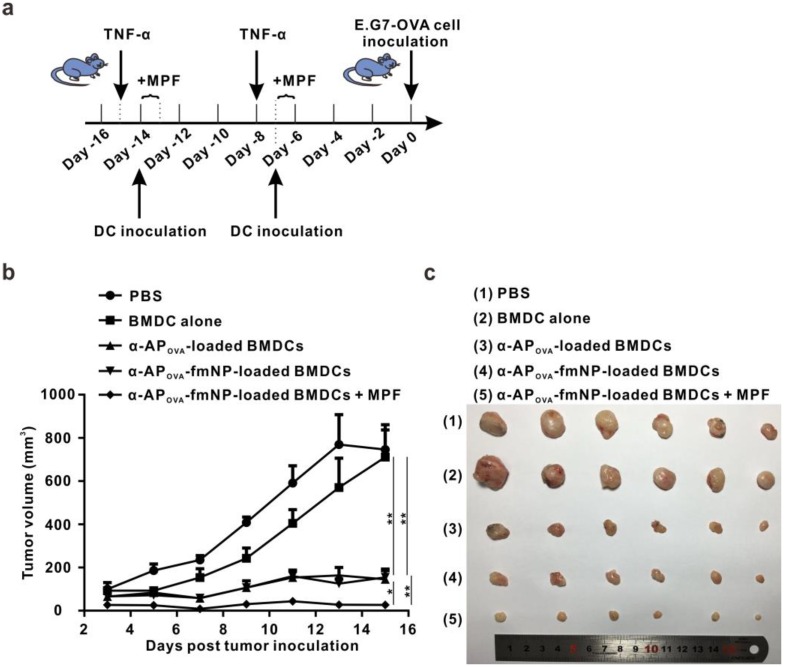
Figure 6.
Evaluation of in vivo anti-tumor efficiency. a) Flow chart of the treatment schedule for α-AP-fmNPs/MPF-assisted, DC-based tumor immunotherapy. b) Tumor growth curve of immunized mice. c) Photograph of the dissected tumor tissues. Data are presented as the mean ± SEM (p1 = 0.0016; p2 = 0.0018; p3 = 0.0349; p4 = 0.0029; n = 6).

