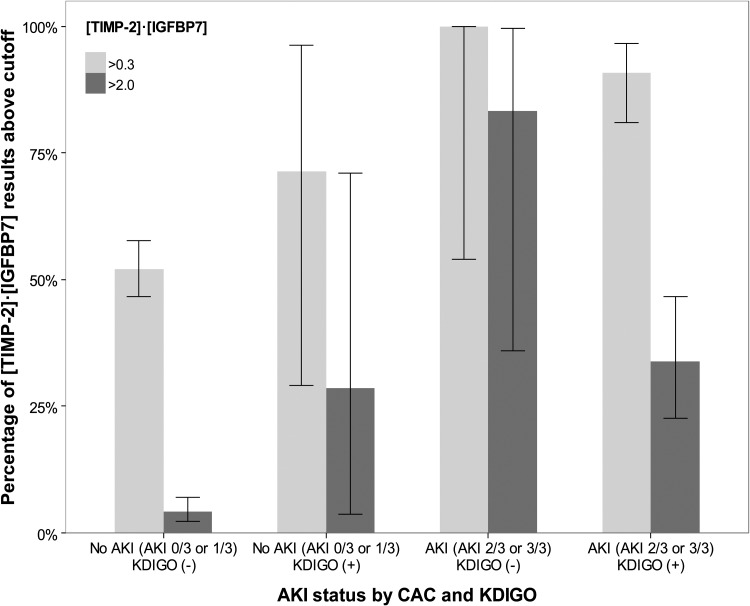
FIGURE 3:
Proportion of [TIMP-2]•[IGFBP7] above the cutpoints of 0.3 and 2.0. Box and whiskers show proportion and 95% CI, respectively. For both cutpoints there was a trend toward a higher proportion of individuals having [TIMP-2]•[IGFBP7] levels above the cutpoint from AKI 0/3 to AKI 3/3 (P < 0.001 for test of trend).

