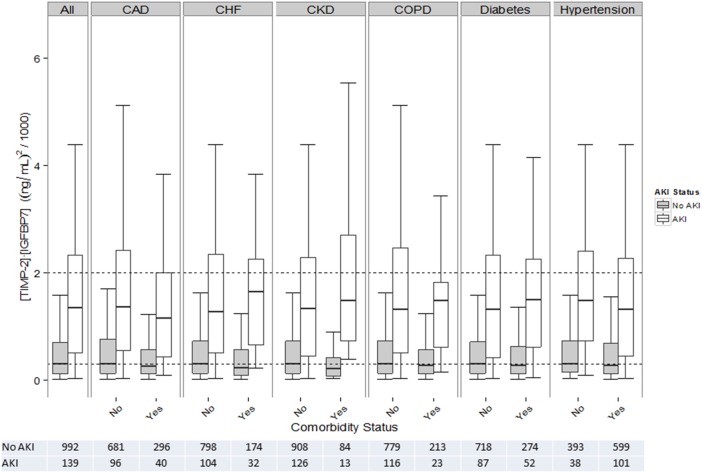
FIGURE 2:
Boxplots of [TIMP2]•[IGFBP7] values across different comorbidity subpopulations by acute kidney injury status. Boxes and whiskers show interquartile ranges (IQRs) and total observed ranges, censored by 1.5 times the IQR. Horizontal lines within the boxes show the medians. Dotted lines refer to the 0.3 and 2.0 cutoffs, for illustrative purposes. Gray and white shading of the boxes indicate the absence or presence of AKI within 12 h. [TIMP2]•[IGFBP7] values were significantly higher in AKI patients than in non-AKI patients for all comparisons shown (P < 0.001 for all). CAD, coronary artery disease; CHF, congestive heart failure; CKD, chronic kidney disease; COPD, chronic obstructive pulmonary disease.

