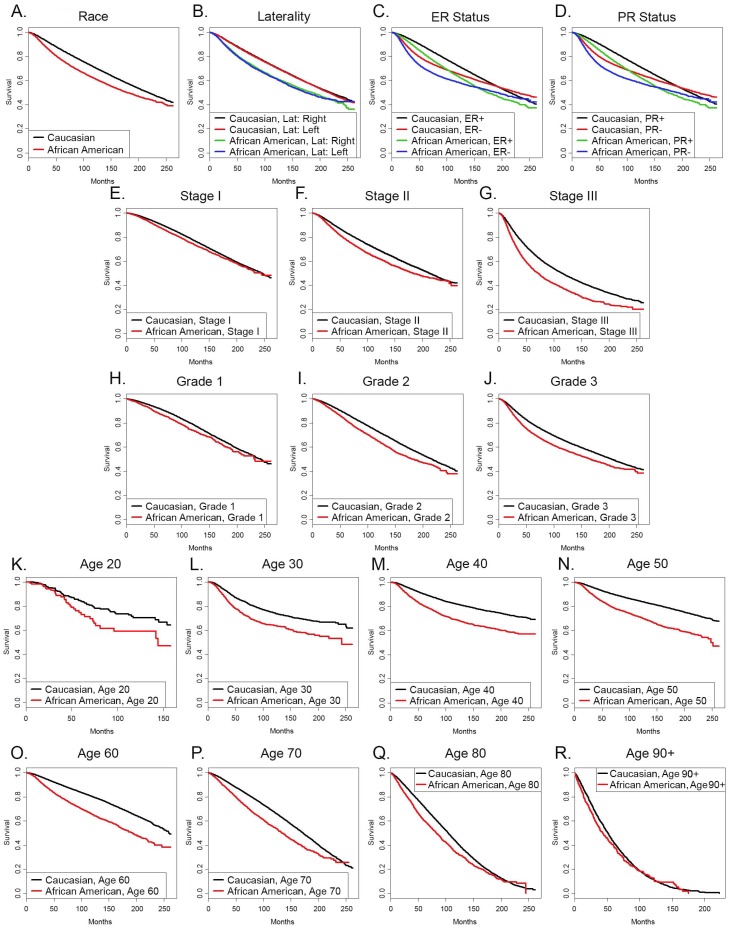
Figure 1.
Kaplan-Meyer survival curves of (A) the entire group of Caucasian and African American patients in our SEER dataset, or patients categorized by (B) laterality, (C) ER status, (D) PR status, (E) stage I, (F) stage II, (G) stage III, (H) grade 1, (I) grade 2, (J) grade 3, (K) age 20, (L) age 30, (M) age 40, (N) age 50, (O) age 60, (P) age 70, (Q) age 80, (R) age 90 and over.

