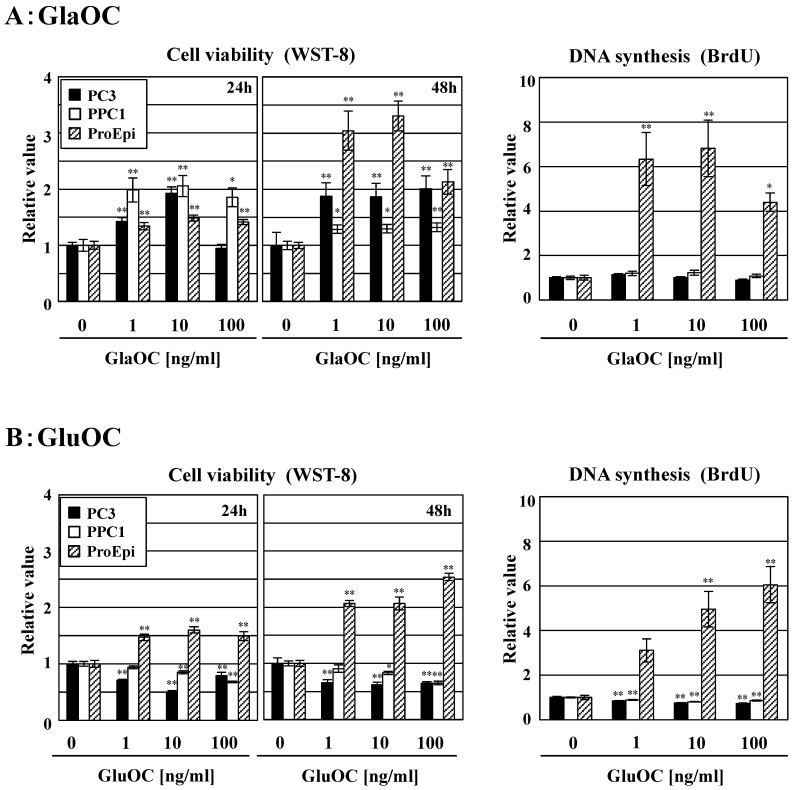
Figure 1.
Effects of GlaOC and GluOC on human prostate cell growth. Effect of GlaOC (A) and GluOC (B) on PC-3, PPC-1, and ProEpi cells. Each assay was performed in triplicate. Left and right panels represent WST-8 (cell viability) assays at 24 h and 48 h and BrdU uptake (DNA synthesis) assays at 24 h, respectively. The data represent mean ± SD from three experiments. Mean data are expressed as a ratio of the control. *P < 0.05 and **P < 0.01 versus the corresponding value for cells treated with vehicle.

