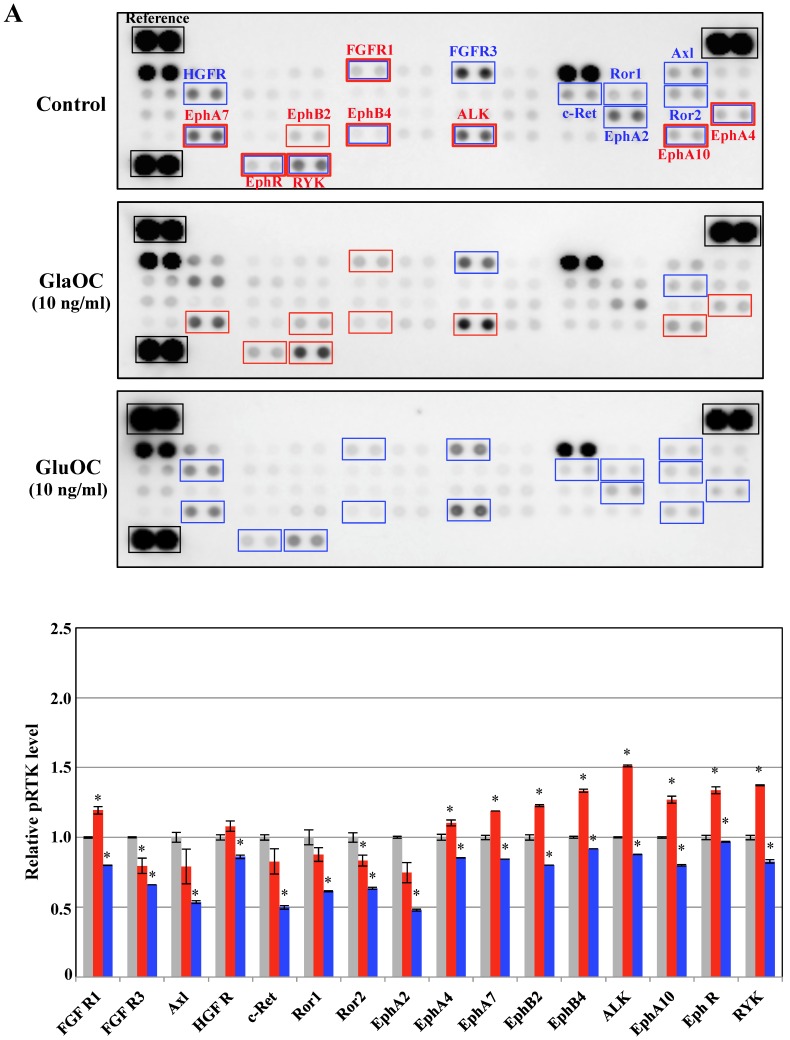
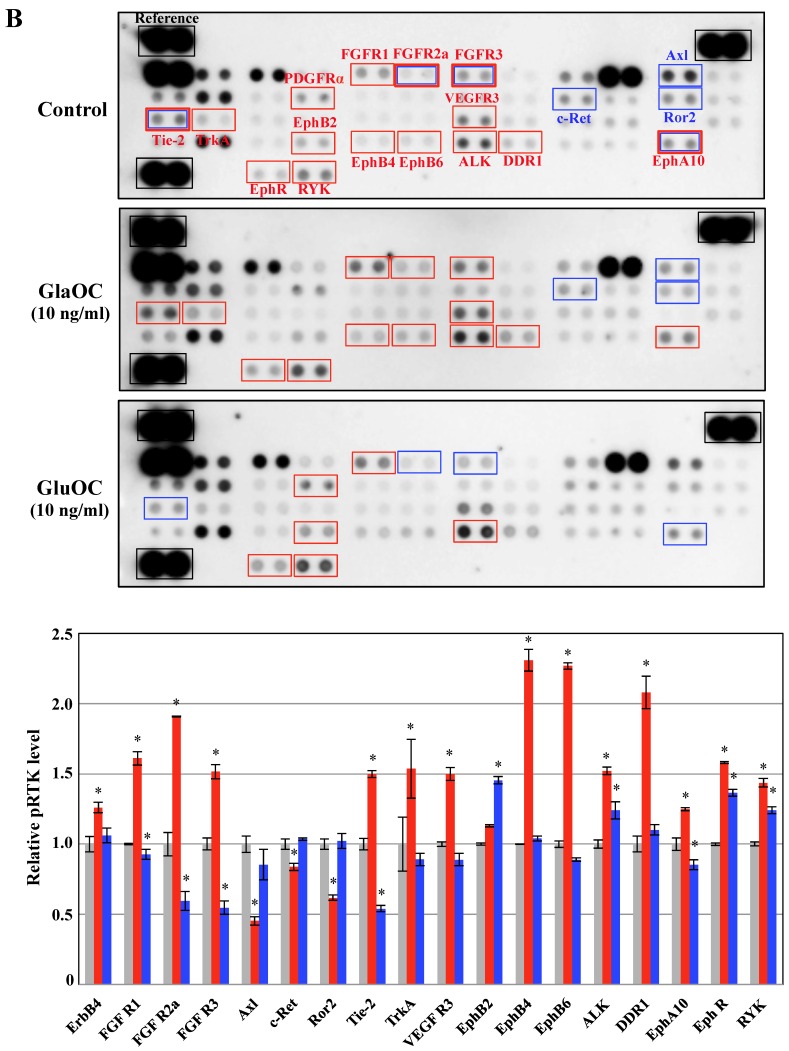
Figure 2.
Phospho-RTKs array in PPC-1 (A) and ProEpi (B) cells. Quantitation of the dot densities of phospho-RTKs was performed using scanning images and ImageQuant LAS 4000 software (GE Healthcare UK, Buckinghamshire, England). Each pair of the kinase dots that increased (red) or decreased (blue) compared with the controls is enclosed in a square. Each assay was repeated three times. Four separate results are summarized in the graphs. *P < 0.05 versus the corresponding value for the control.


