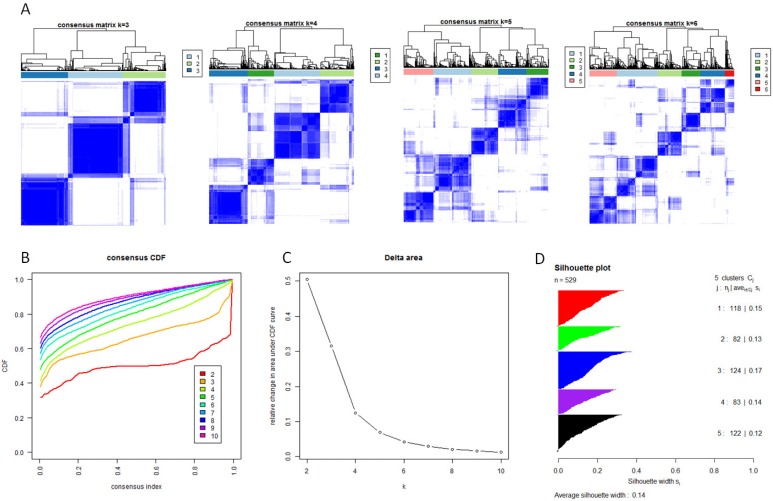
Figure 2.
Identification of five GBM subtypes based on individual KEGG pathway enrichment. (A) Consensus clustering matrix of 529 TCGA samples for k=3 to k=6. (B) Consensus clustering CDF for k=2 to k=10. (C) Relative change in area under CDF curve for k=2 to k=10. (D) Silhouette plot for identification of each clusters.

