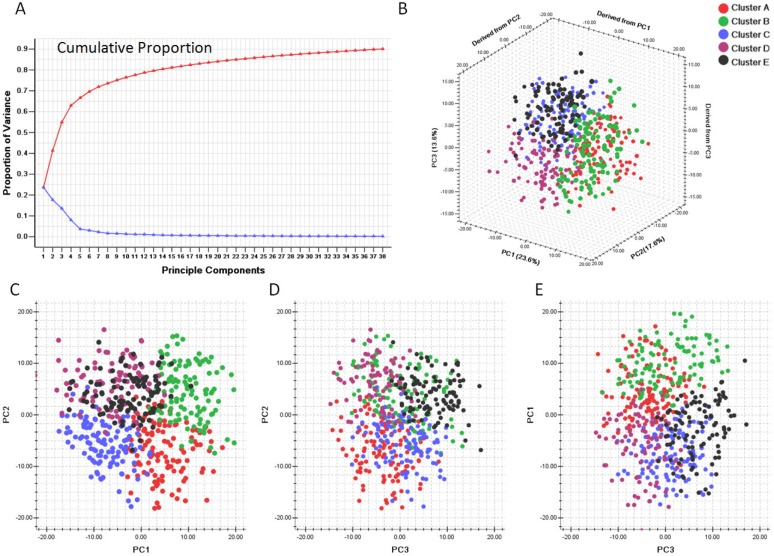
Figure 4.
Principle component analysis based on clusters generated by consensus clustering from SLEA data. A. Variance of principle components evaluated. B. Three dimensional plot of five clusters with top three principle components. C. PCA plot with PC1 and PC2. D. PCA plot with PC1 and PC3. E. PCA plot with PC2 and PC3. PC1: Principle component 1; PC2: Principle component 2; PC3: Principle component 3. The generated five clusters of glioblastoma were differently colored.

