
Figure 2. Application of HTDocking program in FDA-approved CVD drugs.
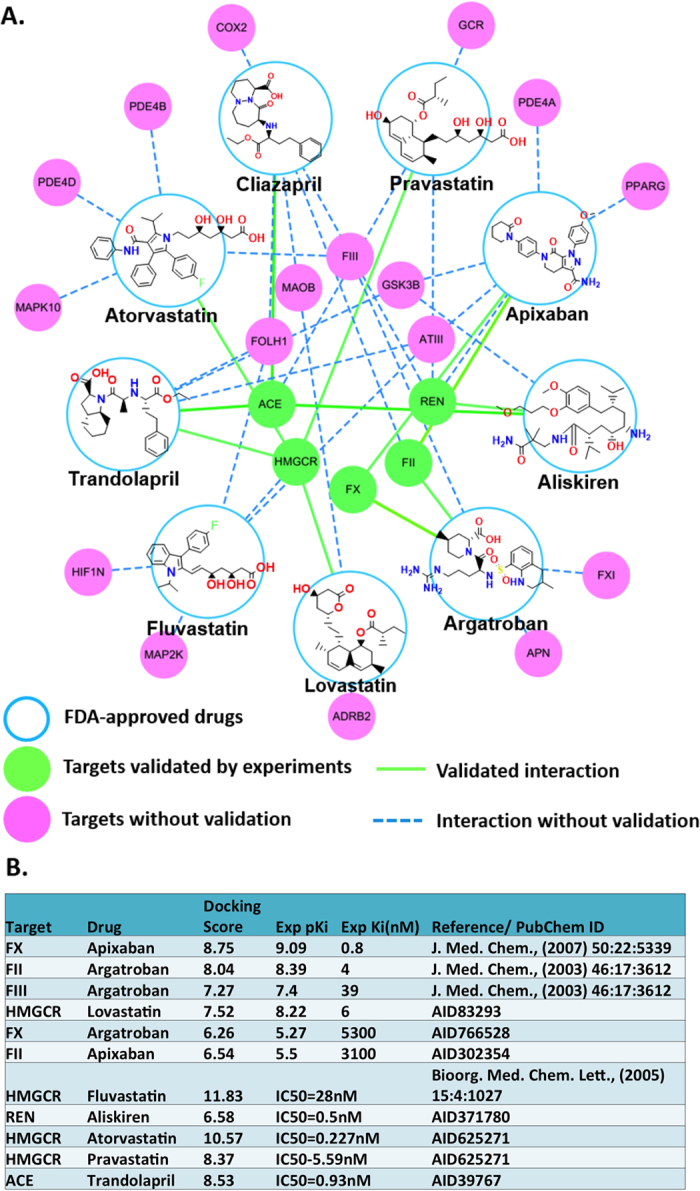
(A) Interaction network between approved CVD drugs and their potential targets. Large circles with chemical structures represent drugs, and nodes stand for targets. Green nodes are targets validated by experiments, and pink nodes are predicted targets without validation. The edges stand for the interactions: blue dashed edges stand for the interactions without validation; green solid edges stand for the validated interactions. (B) Comparison between the docking score and bioassays data.