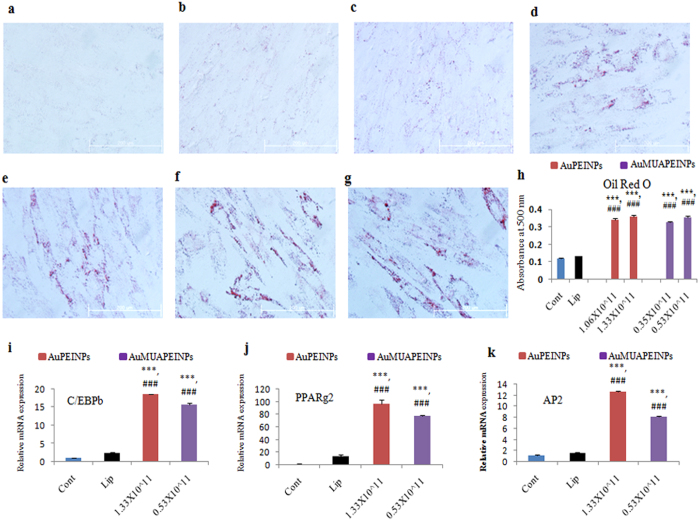
Figure 4. Oil Red O staining and gene expression of adipogenic differentiation markers 7 days after transfecting the C/EBPβ gene.
(a) Oil Red O staining of non-treated control cells cultured in growth media. (b) Oil Red O staining of non-treated control cells cultured in ADM. (c) Oil Red O staining of cells expressing the C/EBPβ gene transfected with Lipofectamine 2000 and cultured in ADM. (d) and (e) Oil Red O staining of cells expressing the C/EBPβ gene transfected with AuPEINPs (1.06 × 10¹¹ and 1.33 × 10¹¹ number of particles, respectively) and cultured in ADM. (f) and (g) Oil Red O staining of cells expressing the C/EBPβ gene transfected with AuMUAPEINPs (0.35 × 10¹¹ and 0.53 × 10¹¹ number of particles, respectively) and cultured in ADM. (h) Quantitative analysis of lipid droplet formation. (i–k) qRT-PCR analysis of the relative mRNA expressions of C/EBPβ, PPARγ2, and AP2 in cells transfected with the C/EBPβ gene and cultured in ADM. All values are expressed as mean ± SD. *p < 0.05, **p < 0.01, and ***p < 0.001 versus the control non-transfected group. #p < 0.05, ##p < 0.01, and ###p < 0.001 versus Lipofectamine transfected group.

