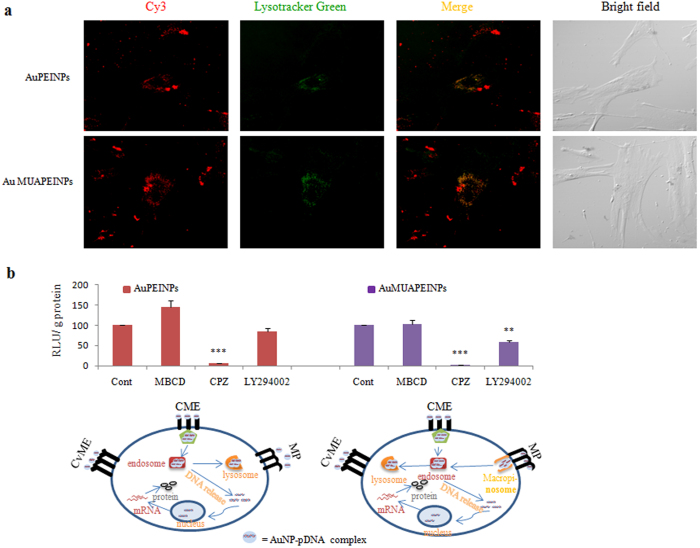
Figure 6. Intracellular distribution and cellular uptake pathways of nanoparticle-DNA complexes.
(a) Confocal micrographs of the intracellular distribution and localization of gold nanoparticle-Cy3-DNA complexes 12 h after transfection. Green regions indicate lysosomes and endosomes stained with LysoTracker Green. Red regions indicate Cy3-DNA. Yellow regions indicate co-localization of nanoparticle-Cy3-DNA complexes with endosomes/lysosomes. (b) The mechanism of cellular uptake of gold nanoparticle-pDNA complexes by hMSCs was investigated by pretreating cells with several endocytosis inhibitors prior to transfecting with the Luc gene. Cells were either cultured at 37 °C as a negative control (Cont) or pretreated with MBCD, chlorpromazine, or LY294002. All values are expressed as mean ± SD. *p < 0.05, **p < 0.01, and ***p < 0.001 versus the non-treated control group.

