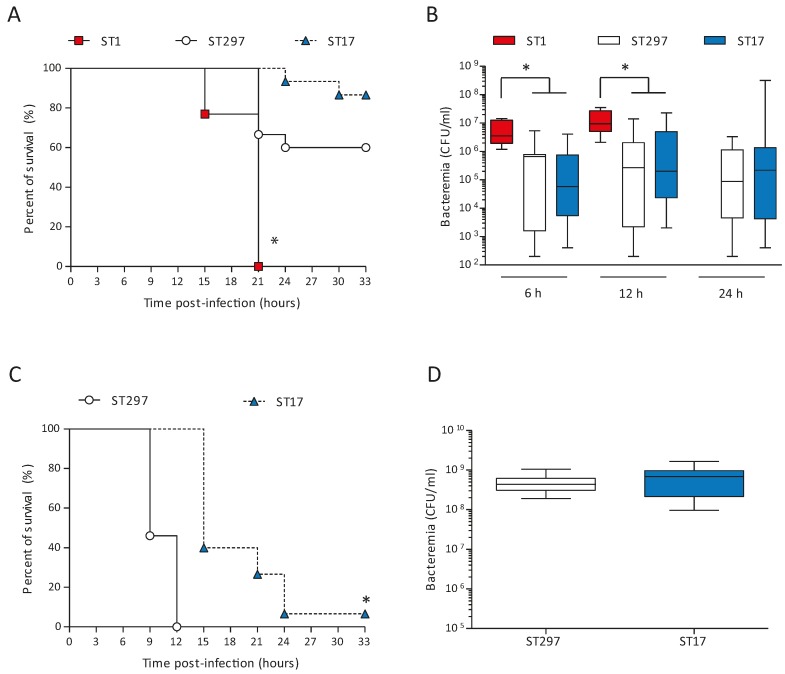
Figure 3.
Susceptibility of mice to intraperitoneal infection with GBS strains NGBS128 (ST17), NGBS357 (ST1), and NGBS375 (ST297). (A) Survival curves of C57BL/6 mice (n = 15 per group) infected using the intraperitoneal route with 1 × 10⁵ CFU of GBS strains. There was a significant difference (* p < 0.0001) in survival between the ST297 strain NGBS375 and the ST17 strain NGBS128 versus the ST1 strain NGBS357 according to the log-rank test (Mantel-Cox). No significant differences were observed between the ST297 and the ST17 strains; (B) Blood bacteremia of mice infected as described in (A). For 6 h and 12 h, there was a significant difference (* p < 0.001) between the ST297 strain and the ST17 strain versus the ST1 strain according to the ANOVA test. No significant differences were observed between the ST297 strain and the ST17 strain. No data were available for the ST1 group at 24 h because all mice had succumbed to the infection before 24 h; (C) Survival curves of C57BL/6 mice infected with 1 × 10⁷ CFU of GBS strains (n = 15). There was a significant difference (* p < 0.0001) between the ST297 strain and the ST17 strain according to the log-rank test (Mantel-Cox); (D) Blood bacteremia of mice infected as described in (C). No significant differences were observed between the ST297 and the ST17 strains. For (B) and (D) blood samples were collected from the tail vein at the indicated time p.i., and plated onto THB agar plates. Colonies were enumerated and data expressed as CFU/mL of blood. Data are displayed as box and whisker plots. The horizontal line represents the median, the box represents the interquartile range and the whiskers represent the range.

