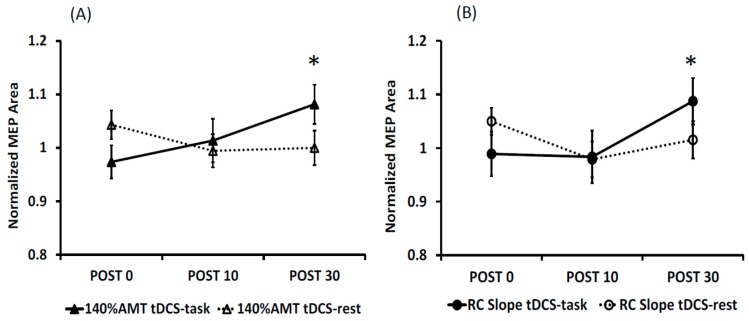
Figure 3.
MEP areas normalized to baseline values at 140% AMT (A) and RC slopes (B) for the tDCS-task and tDCS-rest conditions. An average of Day 1 and 2 values are represented to show the significant interaction of Condition and Time. * denotes a significant difference between the two conditions at POST30 (p < 0.05).

