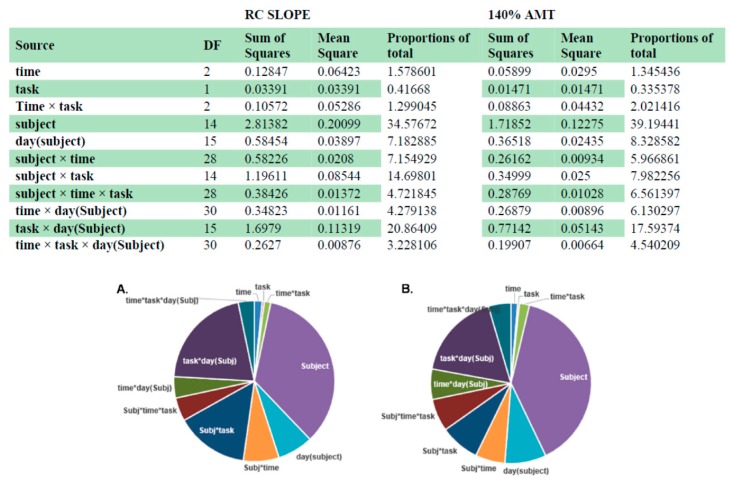
Figure 6.
Contribution of inter- and intra-individual variability to the total variance for MEP amplitude for RC slope and 140% AMT. The table represents the degrees of freedom (DF), sum of squares, mean squares and proportions of total for each factor used in the analyses. The pie chart illustrates the proportions of total. i.e., contribution of sum of squares to the total sum of squares for RC slope (A) and 140% AMT (B).

