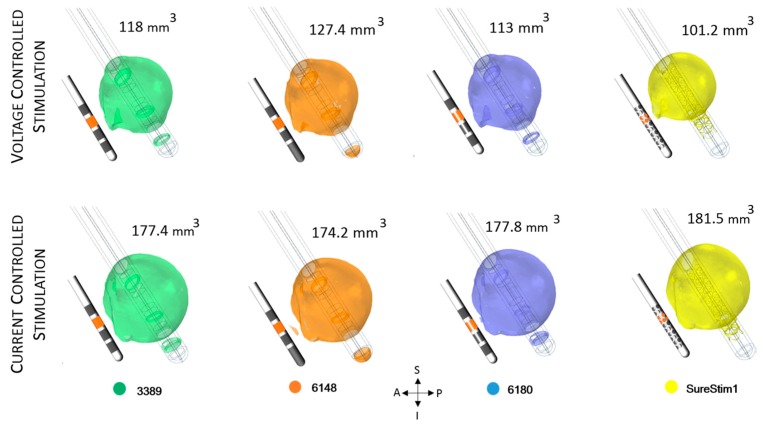
Figure 7.
Electric field (EF) simulated at ZI for each lead depicted with an isosurface of 0.2 V/mm. Active contacts (shown in orange in each lead schematic) set to 3 V (first row) and 3.4 mA (bottom row). EF volume within the selected isosurface shown to the right of the lead. A: anterior, P: posterior, S: superior, I: inferior, L: left, R: right.

