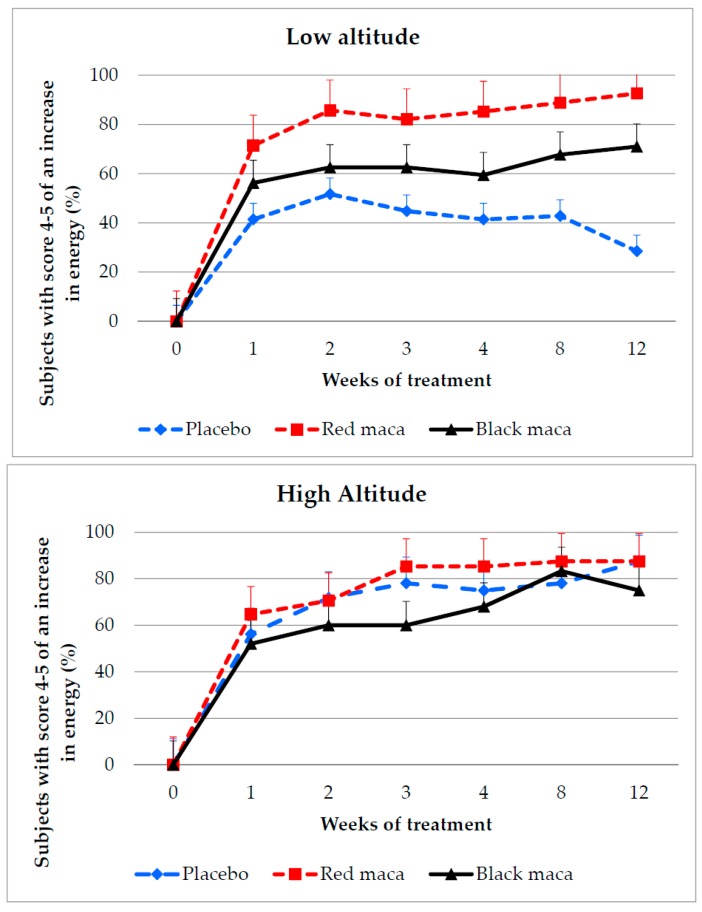
Figure 3.
Percentage of subjects perceiving an increase in energy after treatment for 12 weeks with a placebo, red maca, or black maca at low (Upper) and high (Bottom) altitude. LA: p = 0.07; 0.02; 0.01; 0.003; 0.001 and <0.00001 using chi square test at weeks 1, 2, 3, 4, 8, and 12 comparing treatment with placebo, red maca, or black maca. Placebo group: p > 0.05 over time (weeks 1 to 12); red maca group: p = 0.0001 over time (weeks 1 to 12); black maca group: p > 0.05 over time (weeks 1 to 12). HA: p > 0.05 between placebo group and groups with red or black maca (chi square test at weeks 1, 2, 3, 4, 8 and 12). Placebo: p = 0.0001; red maca: p = 0.0001; black maca: p = 0.0001 over time (weeks 1 to 12).

