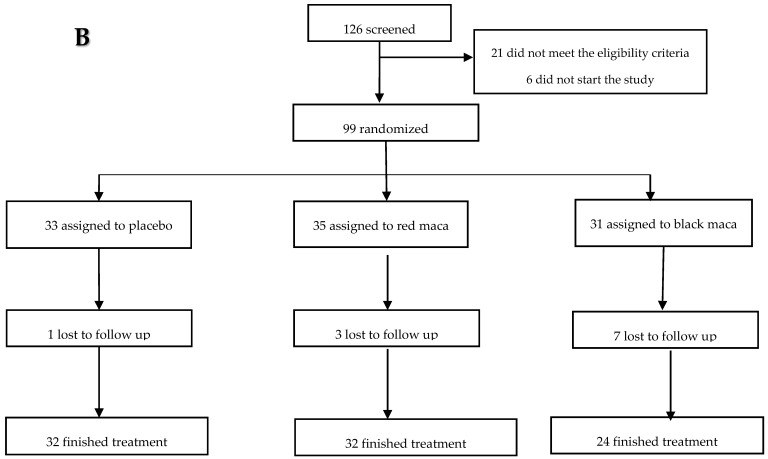
Figure 6.
Flow diagram following the recruitment, enrollment, and number of subjects that finished treatment of the clinical trial at low altitude (A) and high altitude (B). Low altitude: Chi square: 0.11; p = 0.99 with respect to subjects who failed to complete the follow-up among different groups of treatment. High altitude: Chi square: 0.6; p = 0.99 with respect to subjects who failed to complete the follow-up among different treatment groups.


