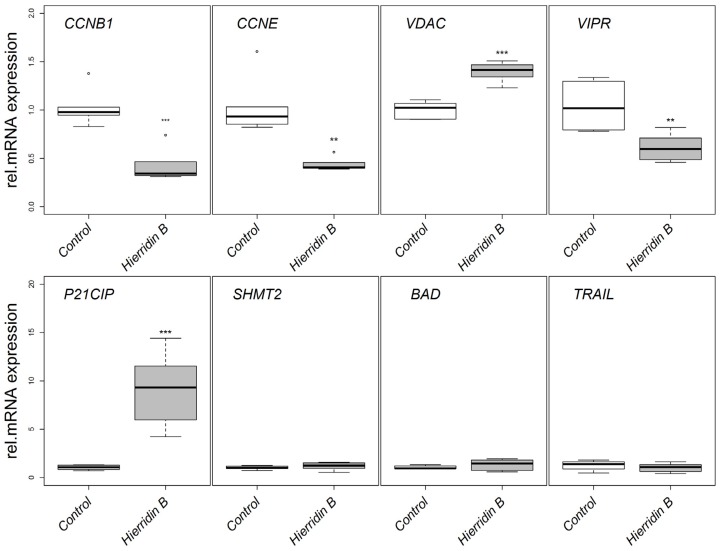
Figure 3.
Relative mRNA expression in the HT-29 adenocarcinoma cell line in response to hierridin B exposure. Data are presented as box-whisker plots (box: 25%–75% percentile, outer bars: 100% percentile without outliers, inner bar: median, cross: mean). The mRNA expression was normalized to the geometrical mean of ribosomal protein L8 (RPL8) and hypoxanthine phosphoribosyl transferase (HPRT1). Statistical differences are indicated by asterisks; * = p < 0.05, ** = p < 0.01, *** = p < 0.001.

