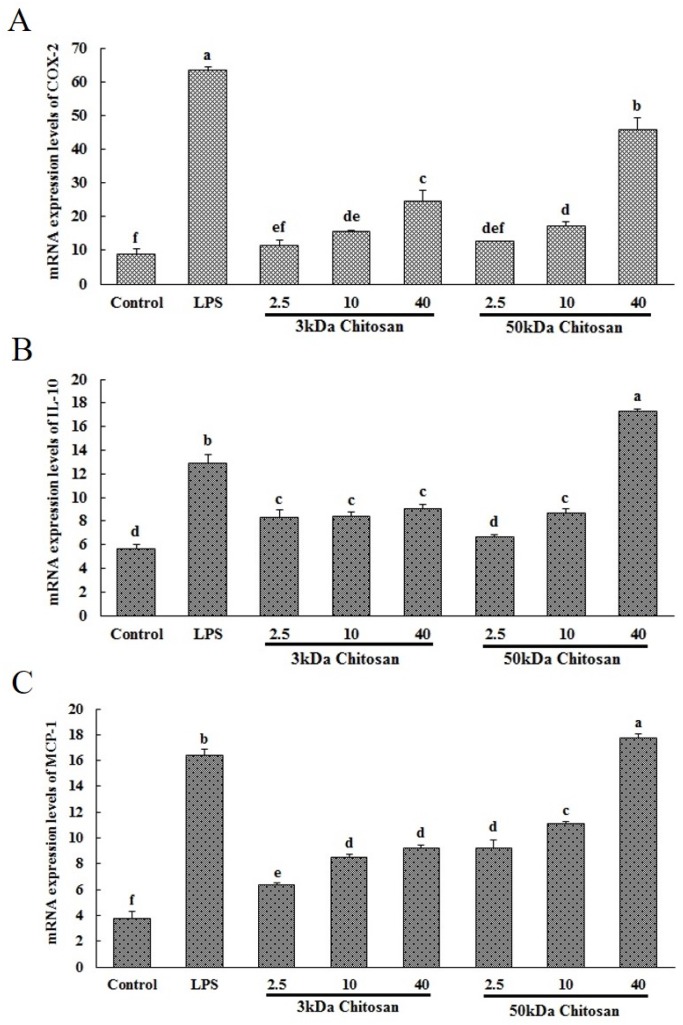
Figure 1.
Effect of LMWCs on the mRNA expression levels of COX-2 (A), IL-10 (B) and MCP-1 (C) in RAW264.7 macrophage. Each cell population (1 × 10⁶ cells/mL) was treated with LMWCs (3 kDa and 50 kDa) at the indicated concentrations of 2.5, 10 and 40 μg/mL or LPS (1 μg/mL) for 24 h, respectively. The untreated cells are used as the control. These represent mean values of three independent experiments. Values are presented as means ± SD (n = 3, three independent experiments). Bars with different letters (a, b, c, d, e, f) are statistically different (p < 0.05).

