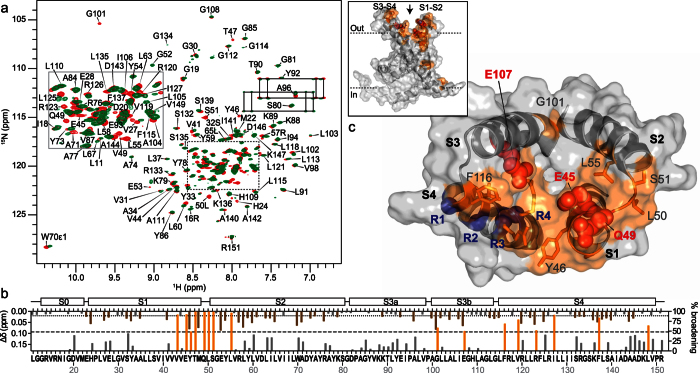
Figure 5. Identification of the VSTx1-binding surface of VSDK.
(a) Overlay of 2D 1H-15N HSQC spectra of 2H/13C/15N-labeled VSDK (100 μM) acquired in the absence (red) or presence (green) of 300 μM VSTx1. (b) Extent of peak broadening (%, right ordinate axis–orange/grey bars) and chemical shift perturbations (Δδ, left ordinate axis–brown bars) observed for VSDK residues upon VSTx1 binding. Peak broadening was observed for residues in the S1-S2 and S3-S4 loops, indicating that both regions are involved in VSTx1 binding. (c) Molecular surface of VSDK (PDB code 2KYH), viewed from the extracellular surface, with residues important for VSTx1 binding based on NMR-CSM and mutagenesis data highlighted in orange and red, respectively. The gating charges on S4 (R1, R2 and R3) are highlighted in blue.

