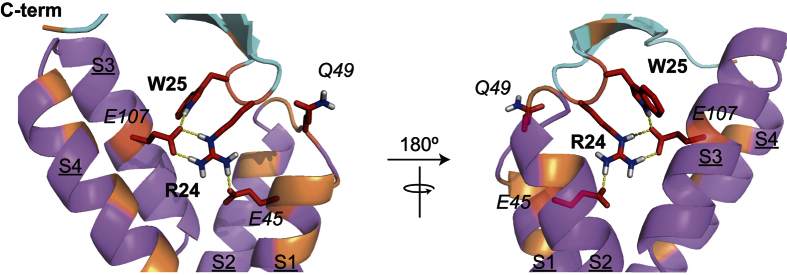
Figure 6. Docking model of the VSDK-VSTx1 complex.
Residues implicated by the NMR data as being involved at the toxin-channel interface are highlighted in red (toxin residues) and orange (channel residues). VSDK residues confirmed to be at the binding interface by mutagenesis are shown in red (E45/Q49/107), whilst peptide residues shown in red (R24/W25) are those that showed the greatest perturbations in NMR titrations with VSDK. Orange residues are the remaining residues indicated by the titrations to be perturbed by complex formation. Hydrogen bonds are shown as yellow dotted lines. The helices are marked as S1-S4 in underlined font, while channel residues are in italics and peptide residues are in bold font. The C-terminus of the peptide is indicated near the S3-S4 loop.

