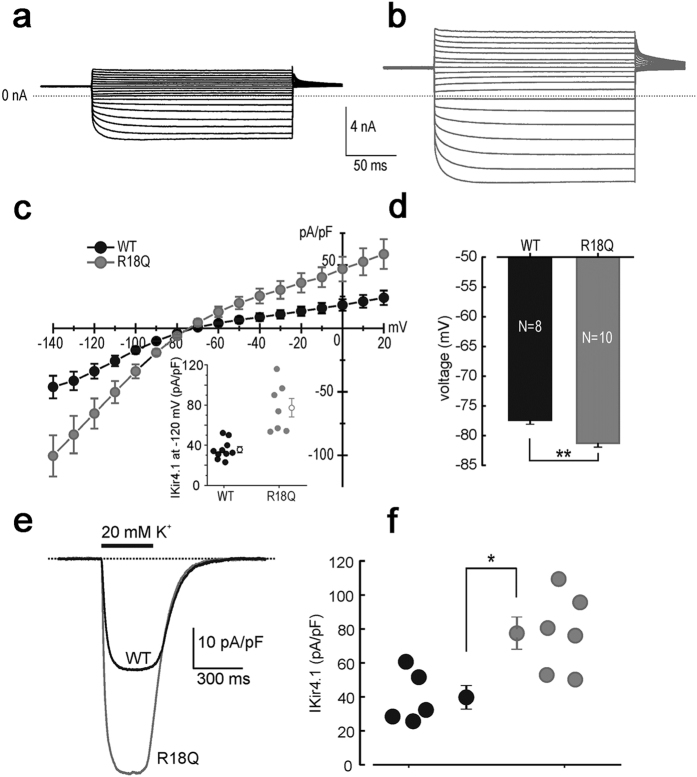
Figure 1. Whole-cell Kir4.1 currents recorded from cells expressing WT and R18Q channels.
Sample current traces for (a) WT and (b) R18Q channels expressed in U251 astrocytoma cells, obtained in response to voltage steps from −140 to +20 mV in 10 mV steps, from a holding potential of −30 mV. (c) Mean current density (pA/pF) as a function of voltage obtained from cells expressing the indicated channels. Inset: scatter plot of the single-cell current densities at −120 mV. The open symbols represent the mean ± SEM. (d) The resting membrane potentials were evaluated in current clamp conditions from cells expressing WT (black bar) or R18Q (grey bar) channels (data are mean ± SEM; **p < 0.01). (e) Sample inward-current densities evoked by puffs of an external solution containing 20 mM KCl from astrocytoma cells expressing the indicated channels (holding potential of −80 mV). (f) WT (black circles) and R18Q (grey circles) current densities elicited from each cell using the experimental protocol described in panel e which were subsequently averaged and depicted (mean ± SEM; *p < 0.05).

