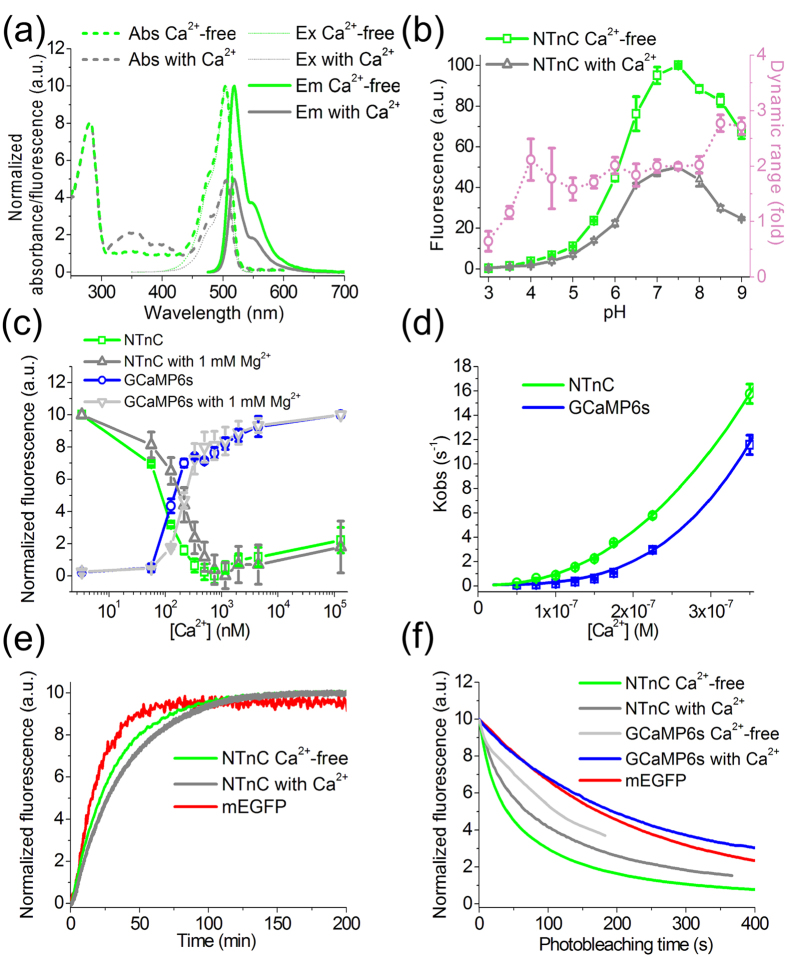
Figure 2. In vitro properties of purified NTnC protein.
(a) Absorbance, excitation and emission spectra of NTnC in Ca2+-free and Ca2+-bound states. (b) Intensity and dynamic range of NTnC as a function of pH. The dynamic range (fold) at each pH value was determined as the ratio of NTnC fluorescence intensity in the absence of Ca2+ to that in the presence of Ca2+. (c) Ca2+ titration curves for NTnC and GCaMP6s in the absence or presence of 1 mM MgCl2. (d) Observed Ca2+ association rates at moderate Ca2+ concentrations (in the range of 0–350 nM) overlaid with the fitting curves (kobs = kon × [Ca2+]n + koff, see Table 1 for the fitting parameters kon and n). (e) Maturation curves for NTnC in the Ca2+-free (green line) and Ca2+-bound (grey line) states and for mEGFP (red line). (f) Photobleaching curves for NTnC and GCaMP6s in Ca2+-free and Ca2+-bound states and for mEGFP. Error represents the standard error of the estimate for the average of three records.

