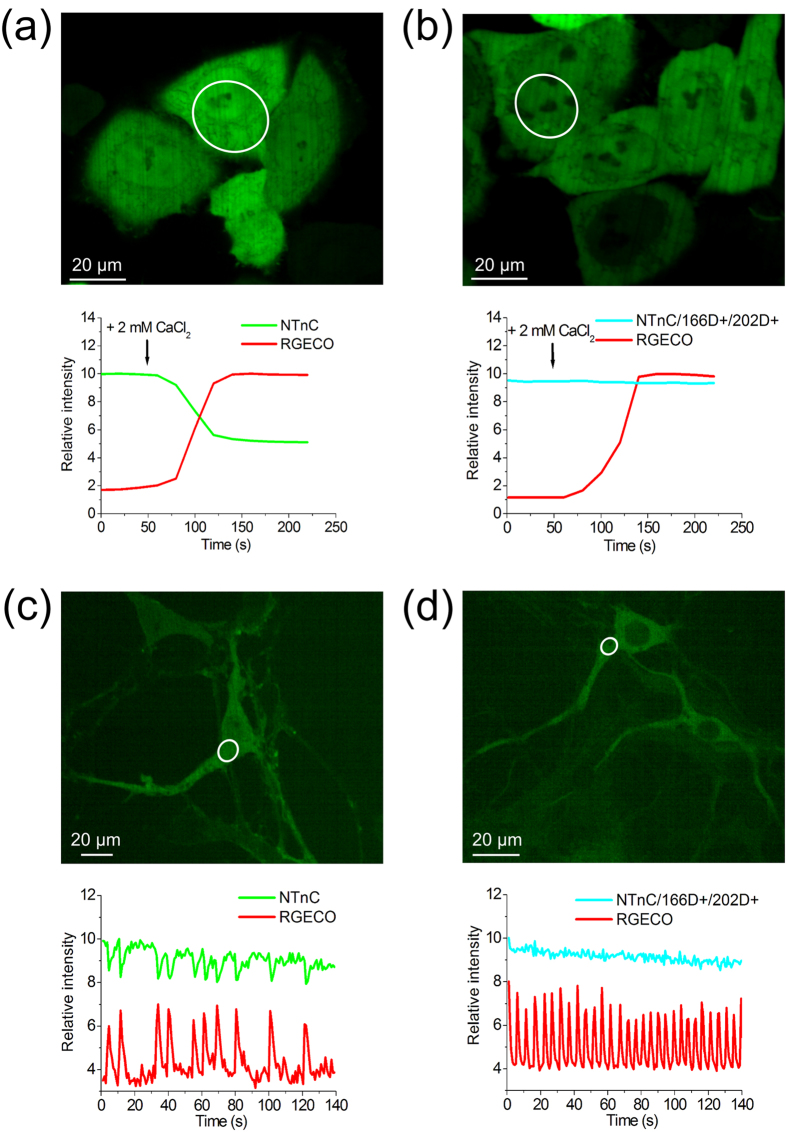
Figure 3. Response of NTnC to variations in Ca2+ concentration in HeLa cells and neuronal cultures.
(a) HeLa Kyoto cells co-expressing NTnC and R-GECO1. The graph illustrates green and red fluorescence changes in response to the addition of 2 mM CaCl2 and 5 μM ionomycin. (b) Co-expression of the NTnC/166D+/202D+ mutant, which has inhibited binding affinity, together with R-GECO1 in HeLa Kyoto cells. The graph shows the changes in green and red fluorescence as a result of the addition of 2 mM CaCl2 and 5 μM ionomycin. R-GECO1 is co-expressed as a control and confirms the increase in Ca2+ concentration. (c) Dissociated neuronal culture co-expressing NTnC and R-GECO1 sensors. The graph shows the green and red fluorescence changes of the NTnC and R-GECO1 indicators as a result of spontaneous neuronal activity. (d) Dissociated neuronal culture co-expressing the NTnC/166D+/202D+ mutant and R-GECO1. Graph shows green and red fluorescence changes of the NTnC/166D+/202D+ mutant and R-GECO1 as a result of spontaneous neuronal activity. (a–d) For cellular images, the red channel is not shown. The graphs illustrate changes in green and red fluorescence in the areas indicated with white circles.

