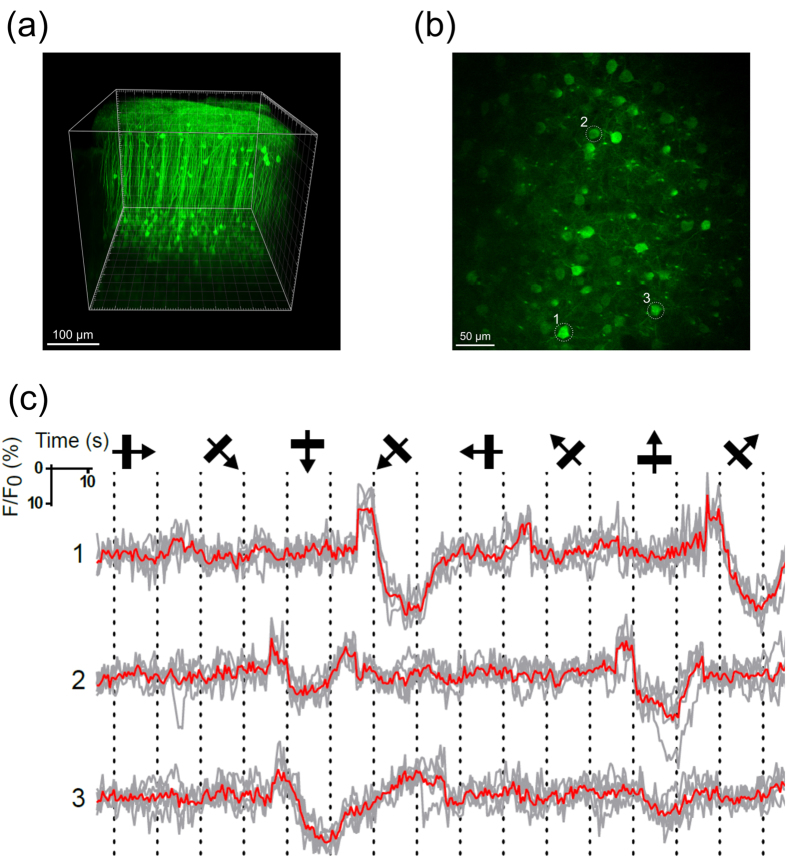
Figure 5. In vivo complex visual stimuli evoked neuronal Ca2+ activity in the mouse cortex as visualized with the calcium sensor NTnC and two-photon microscopy.
(a) Representative image of a 3D volume reconstruction of the mouse V1 at 11 weeks following stereotactic injection of rAAV (AAV-CAG-NTnC) viral particles. (b) Two-photon image of cells in a mouse visual cortex visualized with the calcium indicator NTnC, imaged in vivo at 460 μm below the pial surface. (c) Time-courses of cells 1–3, as marked in (b). Average Ca2+ traces (ΔF/F0) from three neurons during stimulation with the presentation of drifting gratings (eight directions, five repetitions). The directions of the drifting gratings are shown; dashed lines show drift onset and offset, grey – individual trial, red – mean signal over all five repetitions.

