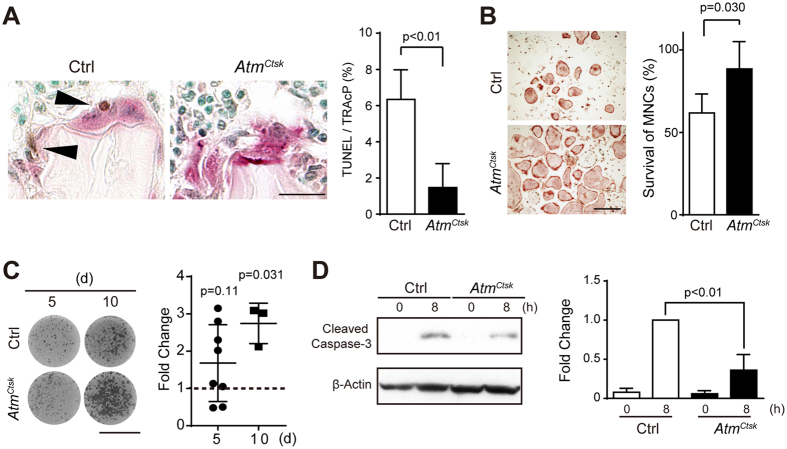
Figure 4. Osteoclasts lacking ATM are less prone to apoptosis.
(A) Tibial sections from 3-week-old Ctrl and AtmCtsk mice dually stained for TUNEL and TRAcP (left panel). The ratio of TUNEL-positive osteoclasts in the tibial sections of 3-week-old control and AtmCtsk mice is shown (right panel). Scale bar: 20 μm. n = 7 for control and 6 for AtmCtsk mice, respectively. At least 50 osteoclasts were evaluated in each genotype. (B) Representative images of TRAcP-stained osteoclasts (left panel) and the ratio of remaining osteoclasts (right panel) 8 h after the withdrawal of sRANKL and M-CSF. The number of osteoclasts before the withdrawal of growth factors was set to 100%. n = 4 and 5 replicates for Ctrl and AtmCtsk, respectively. Scale bar: 0.5 mm. (C) Representative images of osteoclast-formed pits (left) and the ratio of the pit area between Ctrl and AtmCtsk cells (right) on days 5 and 10 after sRANKL stimulation are shown. n = 8 and 3 for day 5 and 10, respectively. Each value was calculated from of 3-4 replicates. (D) Immunoblots for cleaved caspase-3 in Ctrl and AtmCtsk osteoclasts 0 and 8 h after the withdrawal of growth factors (left panel). Quantification of the relative changes in the signal intensity of cleaved caspase-3 (right panel). The signal intensity of cleaved caspase-3 in Ctrl cells 8 h after the starvation was normalized to 1. The data were obtained from 3 independent experiments.

