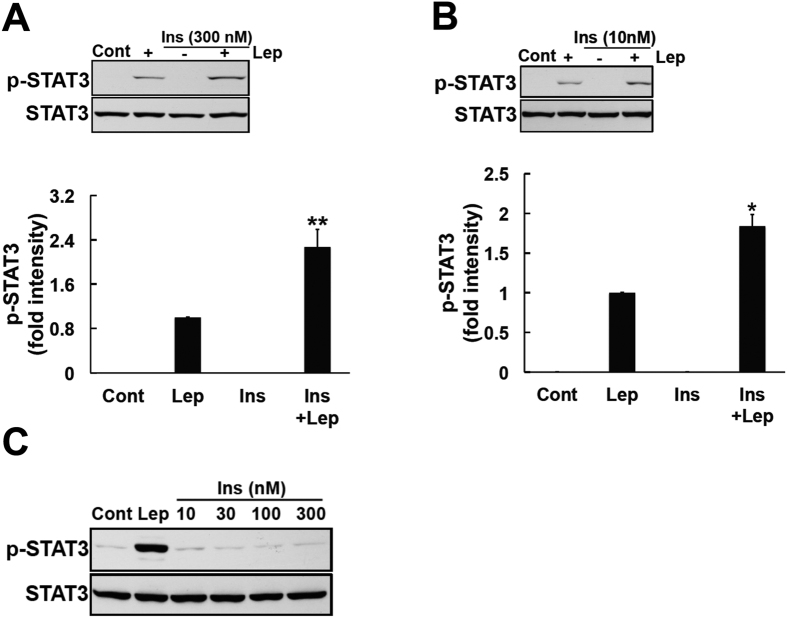
Figure 2. Insulin enhanced leptin-induced STAT3 phosphorylation in SH-SY5Y-ObRb cells.
(A) SH-SY5Y-ObRb cells were incubated in serum-free medium for 20 h. Cells were treated with insulin (300 nM) for 4 h, followed by leptin (0.03 μg/ml, 15 min). Phospho-STAT3 (Tyr705) and STAT3 levels were analyzed by Western blotting. A co-stimulation with insulin and leptin enhanced the leptin-induced phosphorylation of STAT3. (A) densitometric analysis of phospho-STAT3 (Tyr705) was performed using image analysis software. Data are expressed as the mean ± S.E. of 4 independent experiments (n = 4). **P < 0.01. (B) SH-SY5Y-ObRb cells were incubated in serum-free medium for 20 h. Cells were treated with insulin (10 nM) for 4 h, followed by leptin (0.03 μg/ml, 15 min). Phospho-STAT3 (Tyr705) and STAT3 levels were analyzed by Western blotting. Pretreatment with insulin enhanced the leptin-induced phosphorylation of STAT3. A densitometric analysis of phospho-STAT3 (Tyr705) was performed using image analysis software. Data are expressed as the mean ± S.E. of 3 independent experiments (n = 3). *P < 0.05. (C) SH-SY5Y-ObRb cells were incubated in serum-free medium for 24 h. Cells were then treated with insulin (10, 30, 100 and 300 nM). Leptin (0.03 μg/ml, 15 min) was used as a positive control. After 15 min, phospho-STAT3 (Tyr705) and STAT3 levels were analyzed by Western blotting. Insulin did not induce the phosphorylation of STAT3 in SH-SY5Y-ObRb cells. Typical data of 3 independent experiments were shown.

