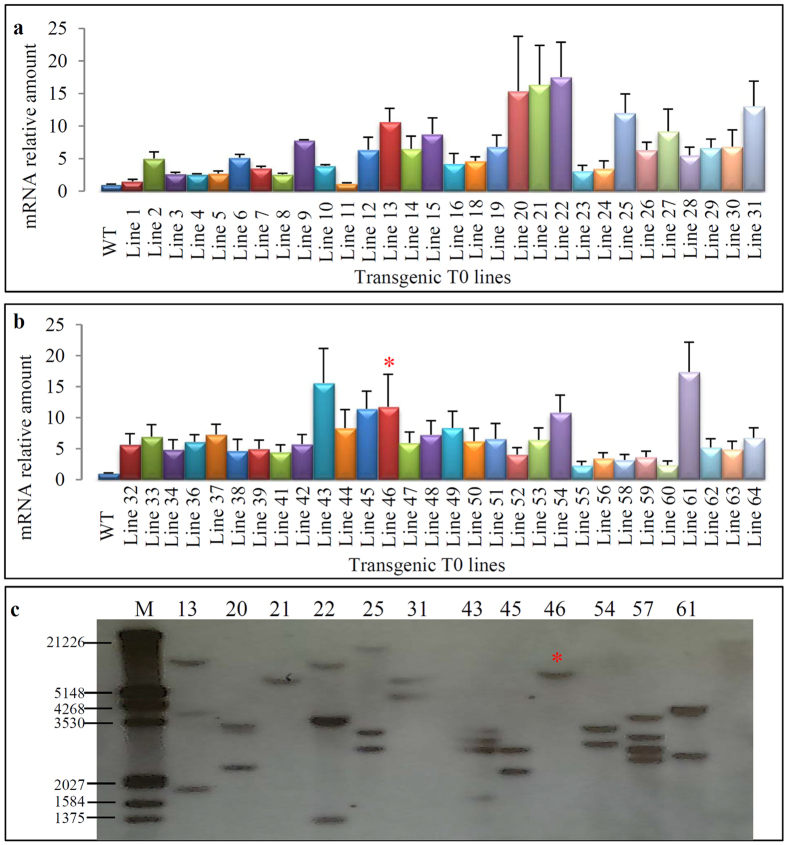
Figure 3. Molecular characterization of 35S::TKTKK2 transgenic plants.
(a,b) show the expression patterns of the TKTKK2 gene in 60 transgenic plants by qRT-PCR. The mRNA relative amount (Y axis) was calculated as shown in Materials and methods. The eEF-1a gene was used as an internal control to normalize the data as shown in Fig. 2b. (c) Copy number detection of T-DNA insertion in transgenic plants by Southern blot hybridization. DNA samples from top 12 transgenic plants in expression were restricted by EcoRV and then transferred into nylon membrane for hybridization using the HPT probe. The red star “*” in (b,c) indicated the line with high level of expression signal and with single copy of T-DNA insertion, which was selected for further analysis.

