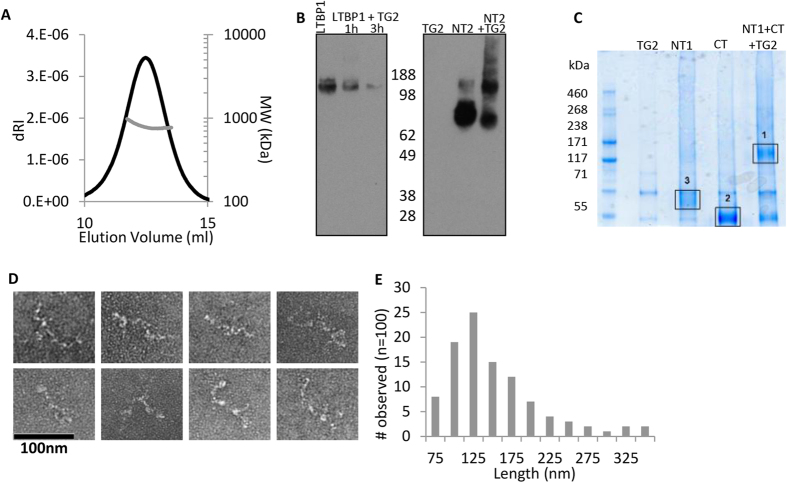
Figure 7. LTBP1 oligomerization via N-N or N-C terminal interactions.
(A) SEC-MALS analysis of oligomeric LTBP1 indicates a molecular mass of 790 kDa. (B) Western blot showing cross-linking of LTBP1 using TG2, for full length LTBP1 a trace amount of dimer is visible after 1 hour. However after 3 hours the majority of cross-linked LTBP1 is too large to enter the gel. An equal amount of total protein was loaded into each well. The N-terminus alone forms monomer, dimer, trimer and tetramer with some higher order species. (C) TG2 cross-linking of the N- and C-terminal regions. Peptides from these bands were identified by MS with band 1 positive for both the N- and C-termini and bands 2 and 3 only positive for peptides from the C- or N-termini, respectively. (D) Oligomers were imaged using negative stain EM and analyzed using ImageJ. (E) Frequency of observation of the maximum straightened length of the oligomer (n = 100 from 32 images).

