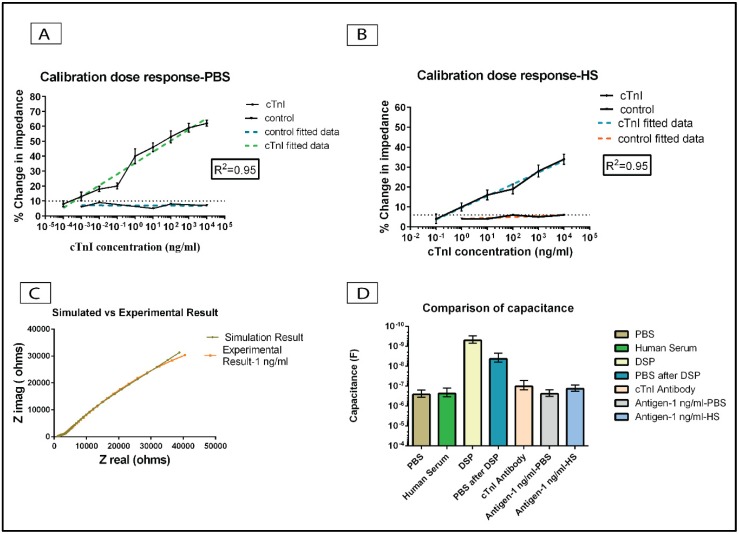
Figure 5.
Calibration dose response analysis on Mo sensor. (A) Calibration dose response analysis in PBS medium. The dotted line indicates the noise threshold. The limit of detection (LoD) for the sensor in the PBS medium is 10 pg/mL; (B) Calibration dose response analysis in HS medium. The LoD for the sensor in HS medium is 1 ng/mL. Error bars represent the standard error of mean from n = 3 replicates; (C) Comparison of experimental vs. simulated result for 1 ng/mL of cTnI antigen; (D) Comparison of capacitance for various assay steps on Mo biosensor.

