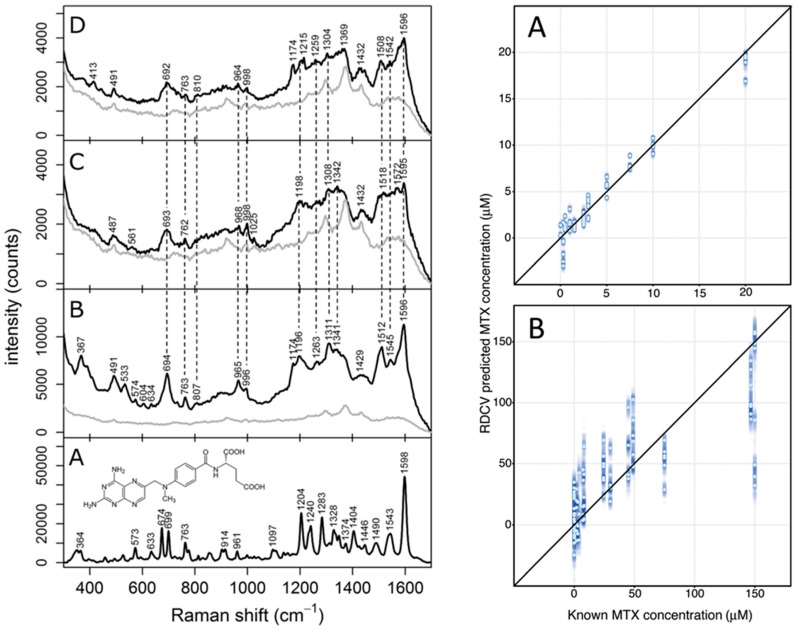
Figure 2.
(Left) Raman of solid MTX (A) and SERS (B–D) spectra of MTX (10 µM) in PBS solution (B), PBS-HSA solution (C), and diluted human serum (D). Light gray lines represent the background SERS signal due to the substrate itself; (Right) diagnostic plots from repeated double cross-validation (RDCV) of SERS data collected from PBS-HSA solutions (A) and diluted human serum (B). Reprinted with permission from [54].

