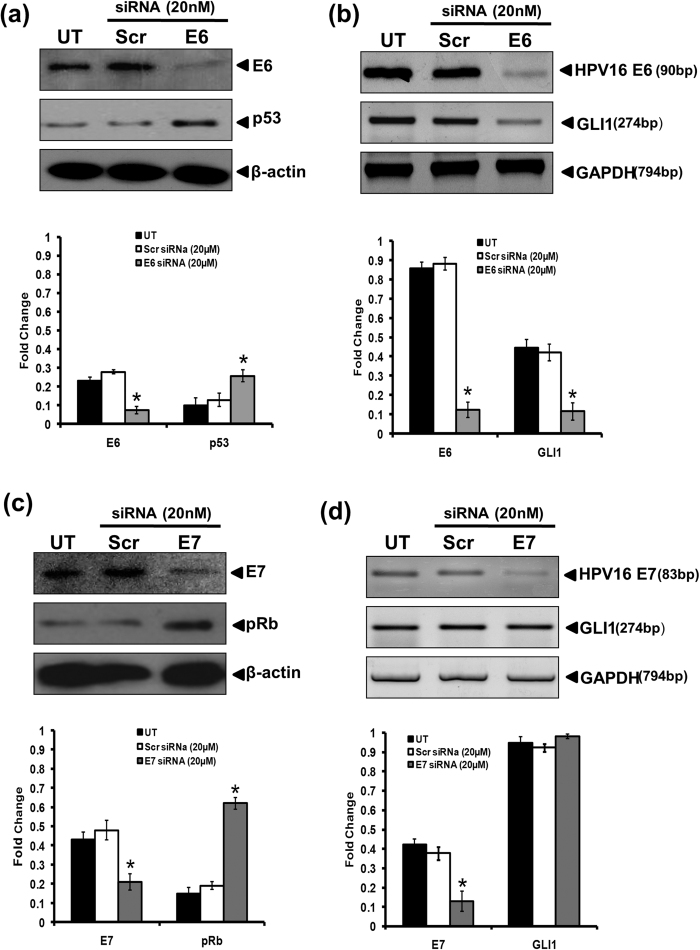
Figure 4. Effect of silencing HPV16 E6 or HPV16 E7 oncogene on their corresponding cellular targets and expression of GLI1.
(a) Representative immunoblots showing expression of E6 and p53 in cellular proteins (50 μg/lane) from SiHa cells treated with HPV16 E6 siRNA (20 μM) for 48 h and evaluated by SDS-PAGE followed by immunoblotting. Blots were striped and reprobed for β-actin as input control. (a, lower panel) Aggregated mean (±S.D.) abundance ratios of the band intensity of E6 and p53 proteins in SiHa cells normalized to β-actin in three independent experiments. *p value ≤ 0.05 versus untreated control cells. (b) Representative photograph of EtBr-stained 2% agarose gel showing amplification of E6 and GLI1 in cDNA prepared from HPV16 E6 siRNA treated and untreated SiHa cells. GAPDH was used as input control for normalization. (b, lower panel) Aggregated mean (±S.D.) abundance ratios of the transcripts w.r.t. GAPDH in three independent experiments. *p value ≤ 0.05 versus untreated control cells. (c) Representative immunoblots showing expression of E7 and pRB in cellular proteins (50 μg/lane) from SiHa cells treated with specific HPV16 E7 siRNA (20 nM) for 48 h and evaluated by SDS-PAGE followed by immunoblotting. Blots were striped and reprobed for β-actin as input control. (c, lower panel) Aggregated mean (±S.D.) abundance ratios of the band intensity of E7 and pRb proteins in SiHa cells normalized to β-actin in three independent experiments. *p value ≤ 0.05 versus untreated control cells. (d) Representative photograph of EtBr-stained 2% agarose gel showing amplification of E7 and GLI1 in cDNA prepared from HPV16 E7 siRNA treated and untreated SiHa cells. GAPDH was used as input control for normalization. (d, lower panel) Aggregated mean (±S.D.) abundance ratios of the transcripts w.r.t. GAPDH in three independent experiments. *p value ≤ 0.05 versus untreated control cells.

