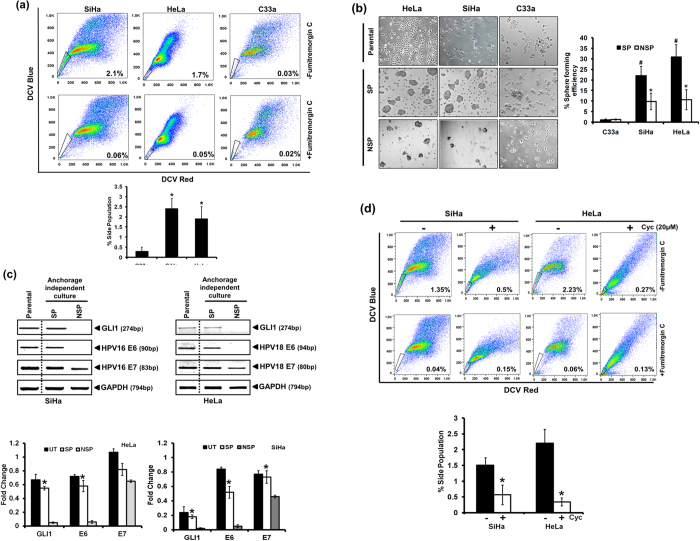
Figure 5. Expression of HPV E6, E7 and GLI1 proteins in cervical cancer stem cells and the effect of GLI inhibition on their proportion.
(a) Flowcytometric analysis of DCV-stained cervical cancer cells showing the proportion of FTC-sensitive, DCVdim cells having functionally active ABCG2 transporters (upper panels). SP cells were identified by back gating of FTC-sensitive DCVdim population (lower panels) ran in parallel in the presence of FTC as control experiment. (a, lower panel) Cumulative data showing average number of cells in SP region in three independent experiments. Values are mean ± SD of the triplicate experiments. *p value ≤ 0.05 versus control C33a cells. (b) Culture of SP and NSP cells sorted from different cervical cancer cell lines and grown in anchorage-independent culture conditions. Representative picture showing the differential ability of isolated SP and NSP cells to form cervicospheres when cultured in low-adhesion substrate in keratinocyte serum free media. Each cell type was cultured as adherent control. (b, right panel) Cumulative data showing sphere-forming efficiency in three independent experiments. Values are mean ± SD of the triplicate experiments. *p value ≤ 0.05 versus control NSP cells. #p value ≤ 0.05 versus control C33a cells. (c) Evaluation of GLI1, E6 and E7 transcript level in SP cells by RT-PCR. Representative photograph of EtBr-stained 2% agarose gel showing PCR amplification of GLI1, E6 and E7 in cDNA prepared from SP, NSP and parental SiHa cells. GAPDH was used as input control for normalization. (c, lower panel) Aggregated mean (±S.D.) abundance ratios of the transcripts w.r.t. GAPDH in three independent experiments. *p value ≤ 0.05 versus control NSP cells. Parental cells cultured in adherent condition were used as reference. (d) Analysis of SP cells in cervical cancer cells, SiHa and HeLa after treatment with 20 μM cyclopamine. (d, lower panel) Cumulative data showing average number of cells in SP region in three independent experiments before and after treatment with cyclopamine. Values are mean ± SD of the triplicate experiments. *p value ≤ 0.05 versus untreated control cells.

