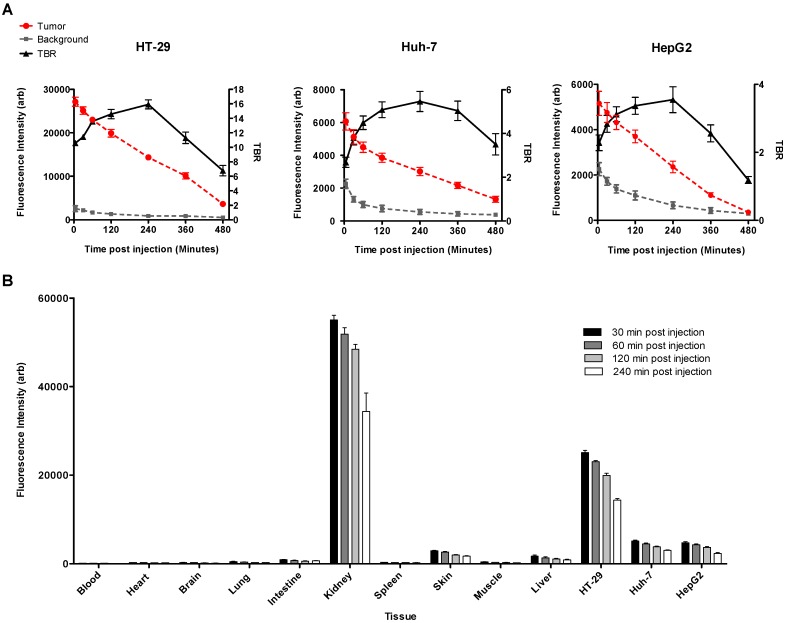
Figure 6.
Mean fluorescence signal intensity was measured in the tumors and the adjacent liver tissue as background over 8 hours after intravenous injection of the MET targeting probe. Graphs show that signal intensity in both tumor and normal liver tissue decreased constantly over time. Tumor to background ratio (TBR) reached a maximum of 15.93 ± 0.61, in HT-29, and 5.46 ± 0.46 in Huh-7, and 3.55 ± 0.38 in HepG2, 4 hours after injection of the probe (A). Biodistribution of the probe in various extracted tissues was assessed 4 hours post-injection in mice with HT-29, Huh7, and HepG2 tumors. Results showed high accumulation of the optical probe in the tumors and its clearance from normal liver parenchyma and other non-targeted background (B).

