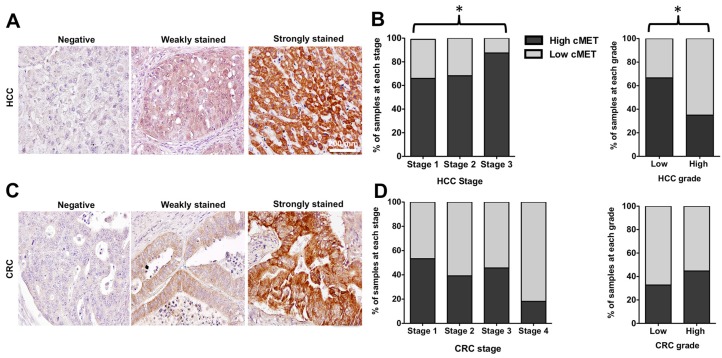
Figure 8.
Representative immunohistochemical staining scores for MET expression in tissue microarrays of hepatocellular carcinoma (HCC) and colorectal adenocarcinoma (CRC); Negative membrane staining, weak staining in invasive tumor cells, strong and complete membrane staining in almost all tumor cells (A&C). Scale bar 200 mm. MET expression level significantly increased with advancing the stage of HCC. The level of MET expression was significantly higher in low-grade cores (B). There was a decreasing trend in MET expression with advancing the stage of CRC, although results were not statistically significant. MET level did not significantly vary with the grade of CRC (D).

