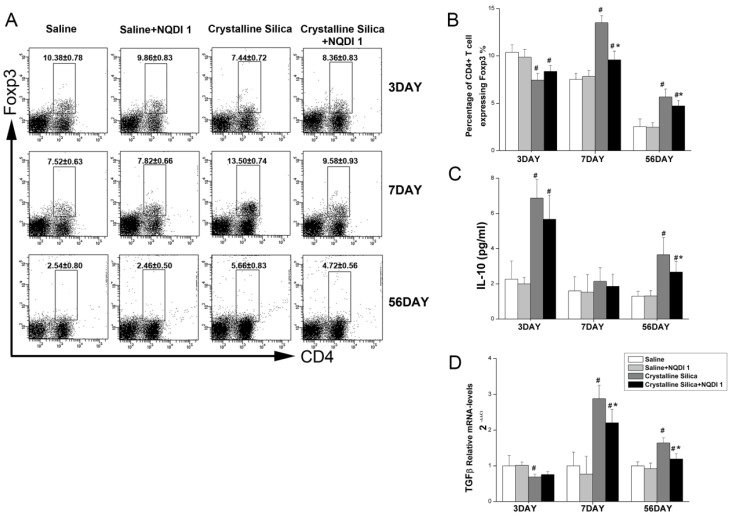
Figure 7.
T regulatory cells influenced by blocking the 4-1BB pathway. A, B Percentage of CD4+ Foxp3+ T regulatory cells in HLN was assayed by flow cytometry. C, D Secretion of IL-10 in BALF was assayed by CBA. Relative expression of TGF-β in the lungs was assayed by real-time PCR. For all experiments, n=5-6 per group per time point. # P<0.05 compared with the saline group; * P<0.05 compared with the crystalline silica group.

