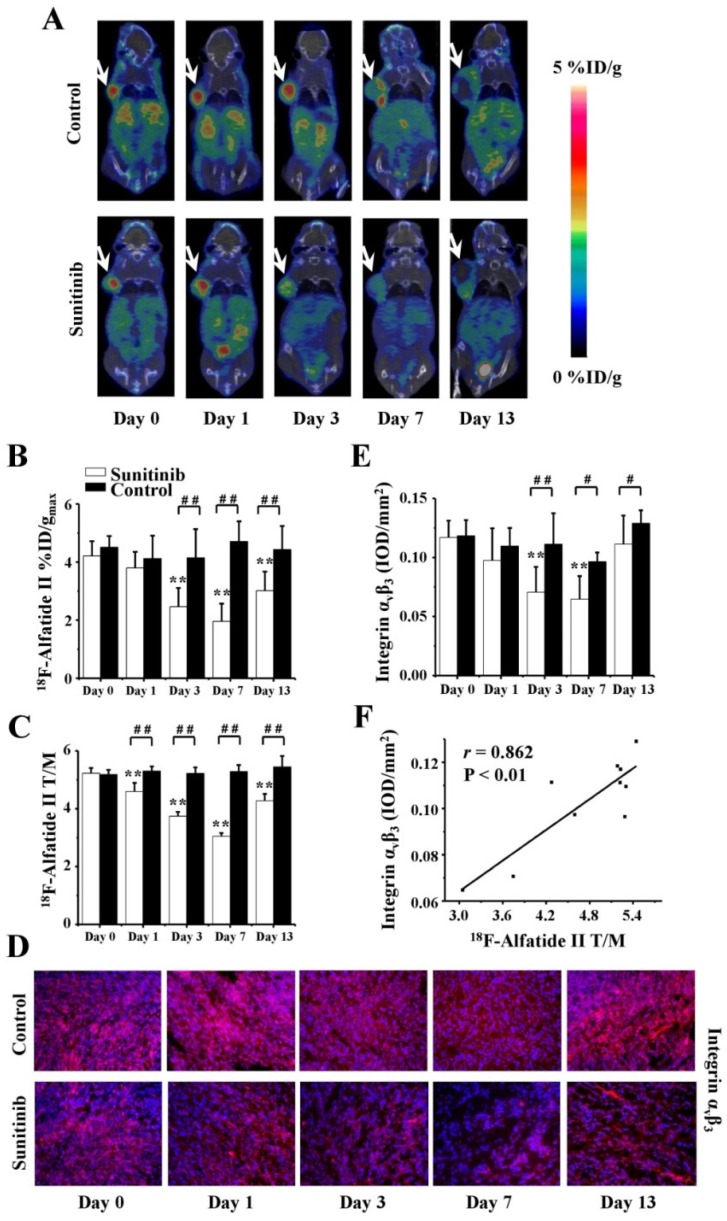
Figure 6.
18F-Alfatide II MicroPET/CT imaging of U87MG tumor-bearing mice, IHC staining for integrin αvβ3 of tumor tissues and the relevant quantitative and correlation analysis. (A) Representative MicroPET/CT images at 1.0 h after intravenous injection of 18F-Alfatide II (5.55 MBq per mouse) on days 0, 1, 3, 7 and 13 post treatment. (B, C) Quantitative %ID/gmax of tumor uptake and the ratios of tumor to contralateral muscle (T/M) in the sunitinib and control groups based on ROIs analysis from 18F-Alfatide II MicroPET/CT. (D, E) IHC and quantitative analysis of tumor sections about integrin αvβ3. (F) Correlations between 18F-Alfatide II T/M and integrin αvβ3 expression of tumor. Notes: The tumors were indicated by arrows. ** P < 0.01, within the sunitinib group, compared to day 0. # P < 0.05, # # P < 0.01, between the sunitinib group and the control group.

