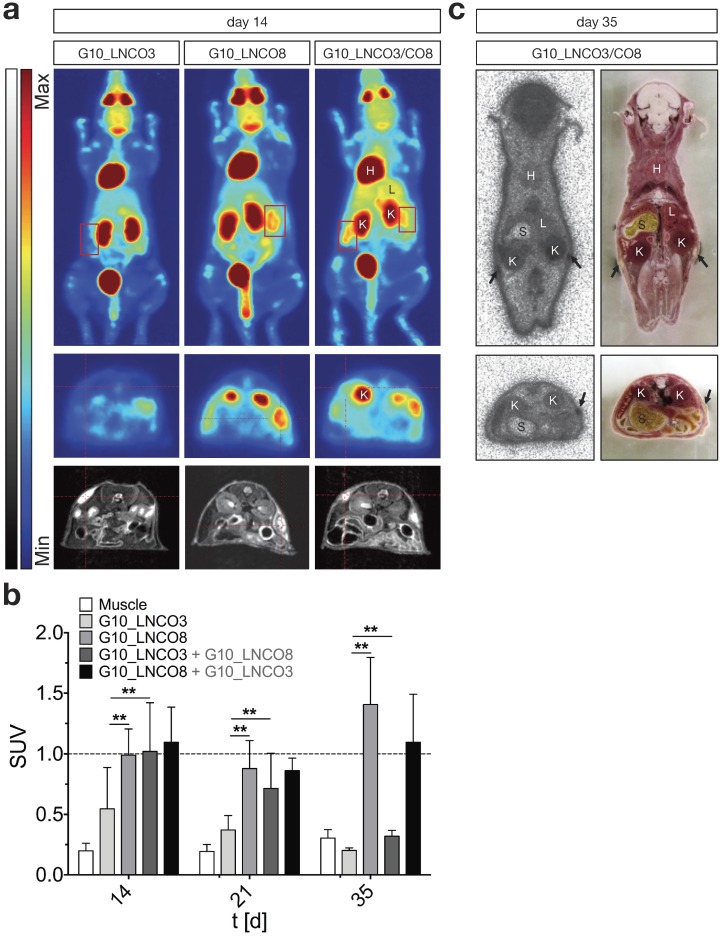
Figure 3.
[18F]FDG PET imaging and quantification. (a) Maximum intensity projection, coronal (0-60 min p.i., upper panel) and transversal projection (mid panel, 30-60 min p.i.) of dynamic PET experiments with [18F]FDG coregistered to MRI projection (lower panel) 14 days after implantation of either G10_LNCO3 (left panel) or G10_LNCO8 (mid panel) as well as of both G10_LNCO3 and G10_LNCO8 (right panel). (b) Mean SUV of [18F]FDG (30‑60 min p.i.) on day 14, 21, and 35 after hydrogel implantation. (c) Autoradiography of double-implanted mice 35 days after implantation (the upper panel). Transversal section is shown in the lower panel. Left side shows autoradiography. Whole animal cryo-sections are shown on the right side. Mean + s.d. * p < 0.05, ** p < 0.01.

