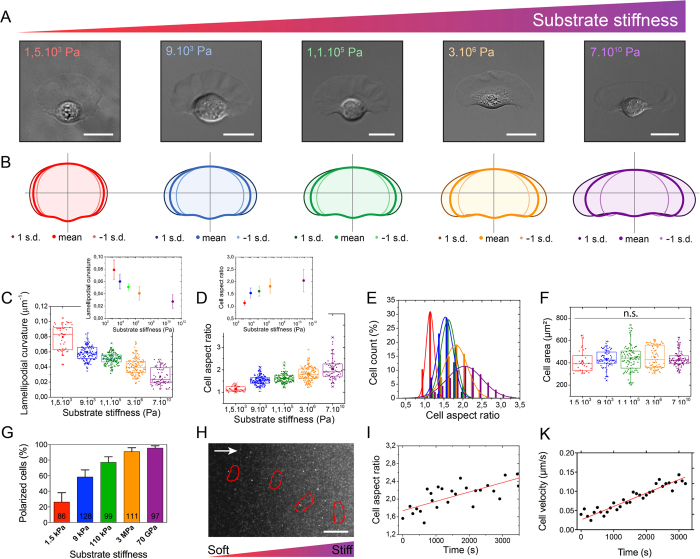
Figure 1. Matrix stiffness controls morphology and polarization of migrating cells.
(A) Differential Interference Contrast (DIC) images of representative fish epithelial keratocytes migrating on culture substrates of different stiffnesses (E = 1.5 kPa in red, 9 kPa in blue, 110 kPa in green, 3 MPa in orange and 70 GPa in purple). (B) The variation of cell morphology, as determined by the analysis of aligned cell outlines, is shown for populations of crawling cells plated on substrates of various stiffnesses (80 ≤ n ≤ 160 for each population). The mean cell shape is presented in bold line for each population of cells with one standard deviation away from the mean in each direction. (C) Evolution of the lamellipodial curvature as a function of the substrate stiffness. The inset shows a semi-log scale. (D) Distribution of the aspect ratios of large populations of keratocytes plated on substrates of varying stiffness. The inset shows a semi-log scale. (E) Histogram of the cell count (%) as a function of the substrate stiffness. Lines are gaussian fits. (F) Distribution of the cell area of live keratocytes plated on different matrix rigidities (85 ≤ n ≤ 160 for each population). N.S indicates that no statistical difference was observed. (G) Histogram of the percentage of polarized cells within large populations of individual keratocytes plated on various matrix stiffnesses. The number of cells is indicated at the bottom of the bars. (H) The typical migration of a keratocyte from a soft (9 kPa) to a stiff (230 kPa) region is superimposed on the fluorescent image of beads embedded in the stiffer region of the hydrogel (see Movie S1). Red lines represent the cell boundary. White arrow indicates the direction of the gradient of rigidity from the softer (9 kPa) to the stiffer region (230 kPa). Scale bar is 50 μm. Temporal evolutions of (I) the cell aspect ratio and (J) the instantaneous cell velocity during the crossing event presented in (H).

