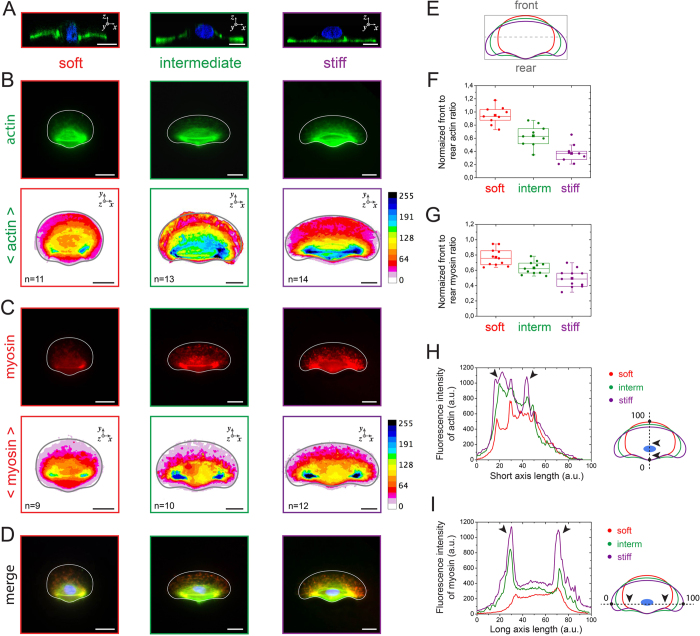
Figure 3. Matrix stiffness affects actin and myosin distribution patterns.
Immunostained images of individual keratocytes plated on soft (left column, in red), intermediate (center column, in green), and stiff (right column, in purple) culture substrates. (A) Cross-sectional confocal views (xz) and (B) normal views (xy) of keratocytes labeled for actin with fluorescent phalloidin. The color-coded average distribution of actin is shown for n = 11 (soft), n = 13 (intermediate) and n = 14 cells (stiff). (C) Normal views of keratocytes immunolabeled for myosin and color-coded average distribution of myosin for n = 9 (soft), n = 10 (intermediate) and n = 12 cells (stiff). (D) Merge images of (B) and (C). The front and rear division schematically presented in (E) was used to estimate the front to rear actin ratio (F) and myosin ration (G) for soft (in red), intermediate (in green) and stiff (in purple) substrates. (H) The distribution of actin was measured along a line from the cell rear (point 0) to the cell front (point 100) for keratocytes plated on soft (in red), intermediate (in green) and stiff (in purple) culture substrates. (I) The distribution of myosin was measured from the left side (point 0) to the right side (point 100) for crawling cells plated on soft (red), intermediate (green) and stiff (purple) culture substrates. Black arrows in (H) and (J) indicate the highest fluorescent signals. Scale bars are 5 μm.

