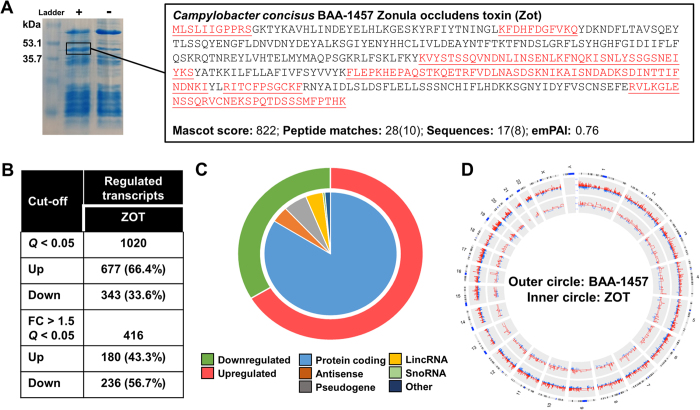
Figure 4. Transcriptional regulation in intestinal epithelial Caco-2 cells exposed to zonula occludens toxin.
(A) In vitro expression of ZOT and confirmation of protein identity using mass spectrometry. (B) Number of significantly regulated transcripts following exposure of Caco-2 cells to ZOT. (C) Numbers of upregulated (red) and downregulated (green) transcripts visualised in the outer circle, and types of regulated transcripts visualised independently in the inner circle. (D) Comparison of the responses of Caco-2 cells to C. concisus BAA-1457 (outer circle) and ZOT (inner circle). Transcripts were mapped according to location on human chromosomes. Responses were visualised using circular Circos plot, with transcripts increased in expression in red and those decreased in blue.

