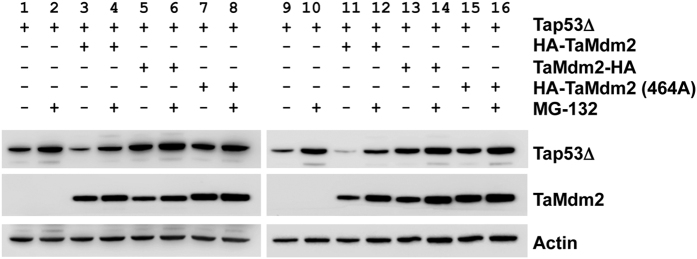
Figure 5. Degradation of Tap53Δ by TaMdm2 in DKO and TKO cells.
Western blot of Tap53Δ levels following co-transfection with various TaMdm2 expressing constructs in either DKO (lanes 1–8) or TKO (lanes 9–16) cells. Lanes: (1 and 9) Tap53Δ; (2 and 10) Tap53Δ with MG132; (3 and 11) Tap53Δ + HA-TaMdm2; (4 and 12) Tap53Δ + HA-TaMdm2 with MG132; (5 and 13) Tap53Δ + TaMdm2-HA; (6 and 14) Tap53Δ + TaMdm2-HA MG132; (7 and 15) Tap53Δ + HA-TaMdm2(C464A); (8 and 16) Tap53Δ + HA-TaMdm2(C464A) with MG132. TaMdm2 levels can be seen in the middle panel and the loading control can be found in the lower panel. See Supplementary Information for uncropped blots.

