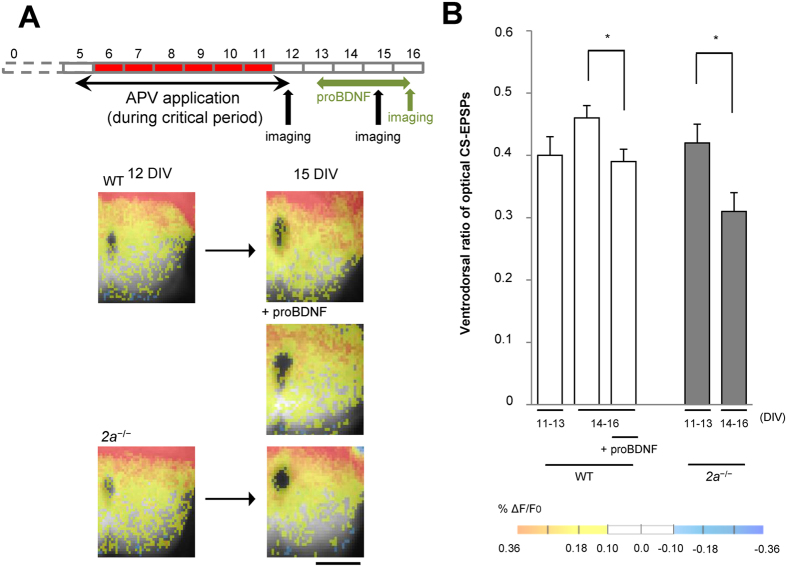
Figure 2. CS synapses in the ventral spinal cord were eliminated upon increasing synaptic 2B.
(A) Reduction of CS synaptic activity in the ventral side after the critical period in 2a−/− mice. Spatial distribution of CS synapses determined using optical CS-EPSPs in WT, proBDNF-treated or 2a−/− mice at 11–13 or 14–16 DIV. Scale bar = 250 μm. (B) Ventrodorsal ratios of optical CS-EPSPs in the indicated culture pairs from 11–13 DIV (0.40 ± 0.03 in WT mice, n = 12, Ns = 12, Nm = 6; 0.42 ± 0.03 in 2a−/− mice, n = 6, Ns = 6, Nm = 6) or from 14–16 DIV (0.46 ± 0.02 in WT mice, n = 17, Ns = 17, Nm = 8; 0.39 ± 0.02 in proBDNF-treated mice, n = 4, Ns = 4, Nm = 4; 0.31 ± 0.03 in 2a−/− mice, n = 7, Ns = 7, Nm = 6).

