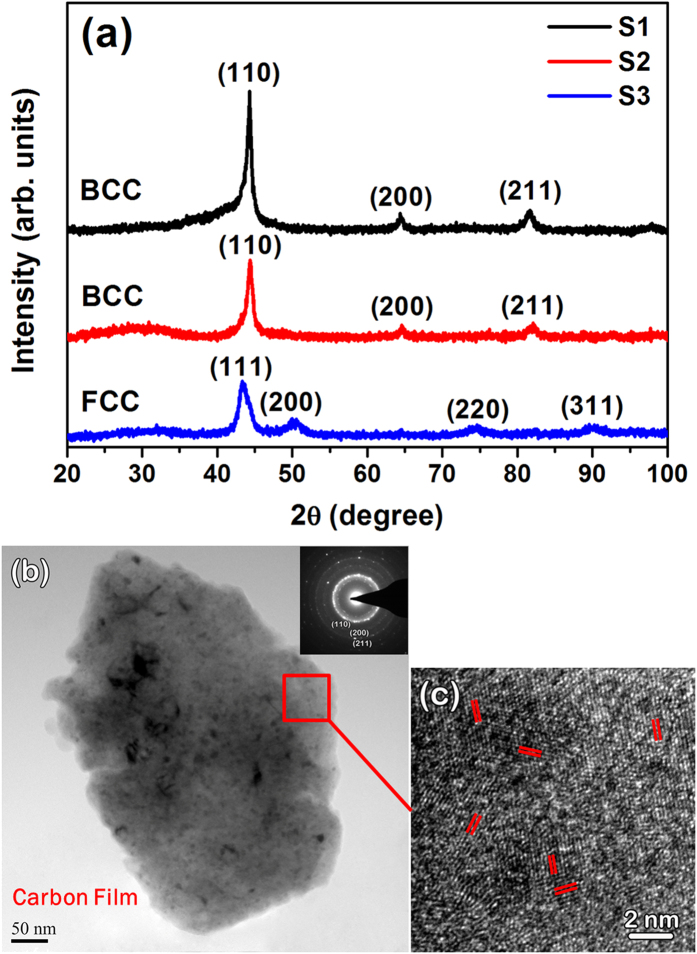
Figure 1.
(a) XRD curves of the HEA AlCoCrTiZn (S1), AlCoCrFeNi (S2), and CoCrFeMnNi (S3) after 60 h milling. (b) TEM bright field image of theS1 particles after 60 h milling, andthe inset shows the corresponding selected area electron diffractionpattern. (c) Thecorresponding HRTEM imageobtained from the area marked in (b).

