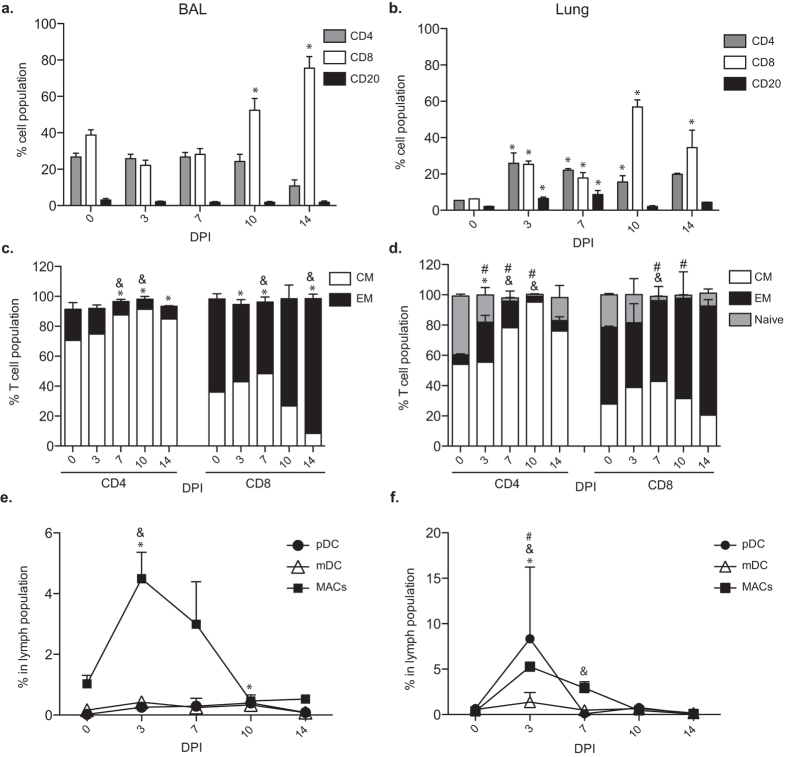
Figure 3. SVV infection induces immune infiltration.
(a,b) The frequencies (means ± SEM) of CD4, CD8 and CD20 positive cells in (a) BAL and (b) the lungs (*p < 0.05 compared to day 0). (c,d) The percentage of naïve, central memory (CM) and effector memory (EM) CD4 and CD8 T cells in the (c) BAL (&p < 0.05 for CM; *p < 0.05 for EM compared to day 0) and (d) lungs (&p < 0.05 for CM; *p < 0.05 for EM; #p < 0.05 for naïve compared to day 0). (e,f) The percentage of plasmacytoid DCs (pDCs), myeloid DCs (mDCs), and macrophages (MACs) in (e) BAL and (f) lungs (&p < 0.05 for MACs; *p < 0.05 for pDCs; #p < 0.05 for mDCs). BAL: n = 14 (0 days post infection, DPI), n = 11 (3 DPI), n = 8 (7 DPI), n = 5 (10 DPI), n = 3 (14 DPI); Lung: n = 3 (0 DPI), n = 3 (3 DPI), n = 3 (7 DPI), n = 2 (10 DPI), n = 3 (14 DPI). Tissues used were from the infected right lobe.

