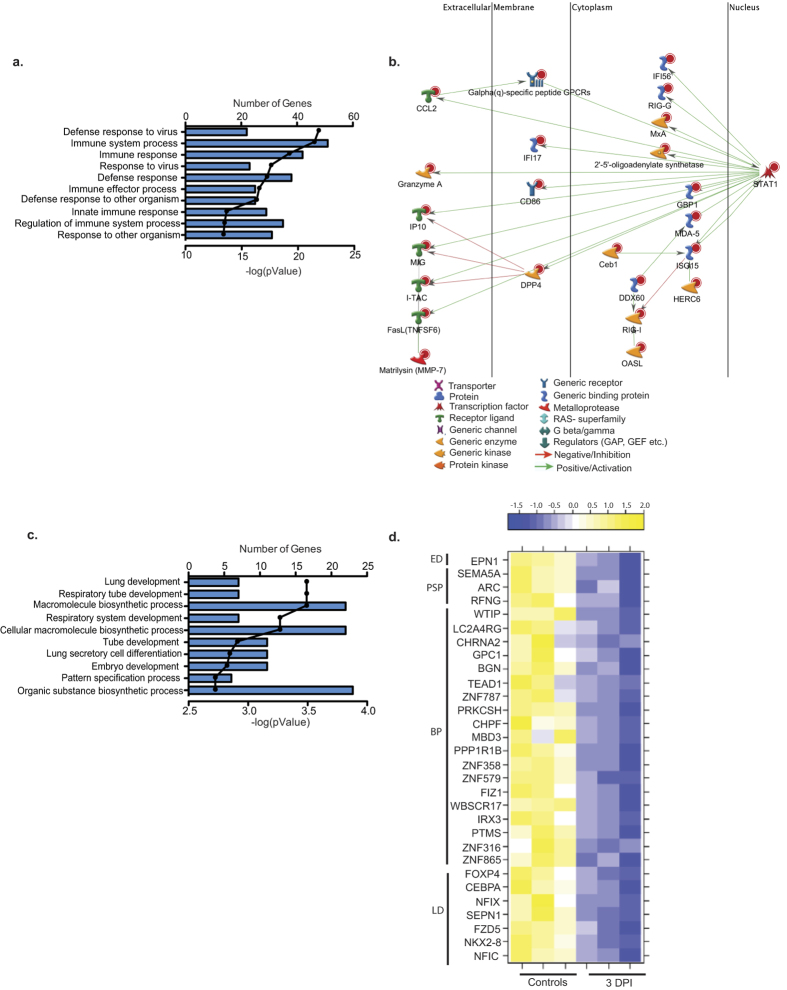
Figure 6. DEGs detected 3 DPI play a role in innate immunity and lung development.
(a) Bar graph shows the number of genes mapping to each of the 10 most statistically significant GO terms to which the 106 up-regulated genes enriched. Line represents the −log(p-value) associated with each GO term. (b) Network of DEGs mapping to the GO process “immune system” that directly interact. (c) Bar graph shows the number of genes mapping to each of the 10 most statistically significant GO processes to which the 54 down-regulated genes enriched. Line represents the −log(p-value) associated with each GO term. (d) Heat map of the 30 down-regulated DEGs that enriched to the GO terms described in (c) grouped by the GO term to which they mapped: ED = Embryo development, PSP = pattern specification process, BP = biosynthetic process and LD = Lung development.

