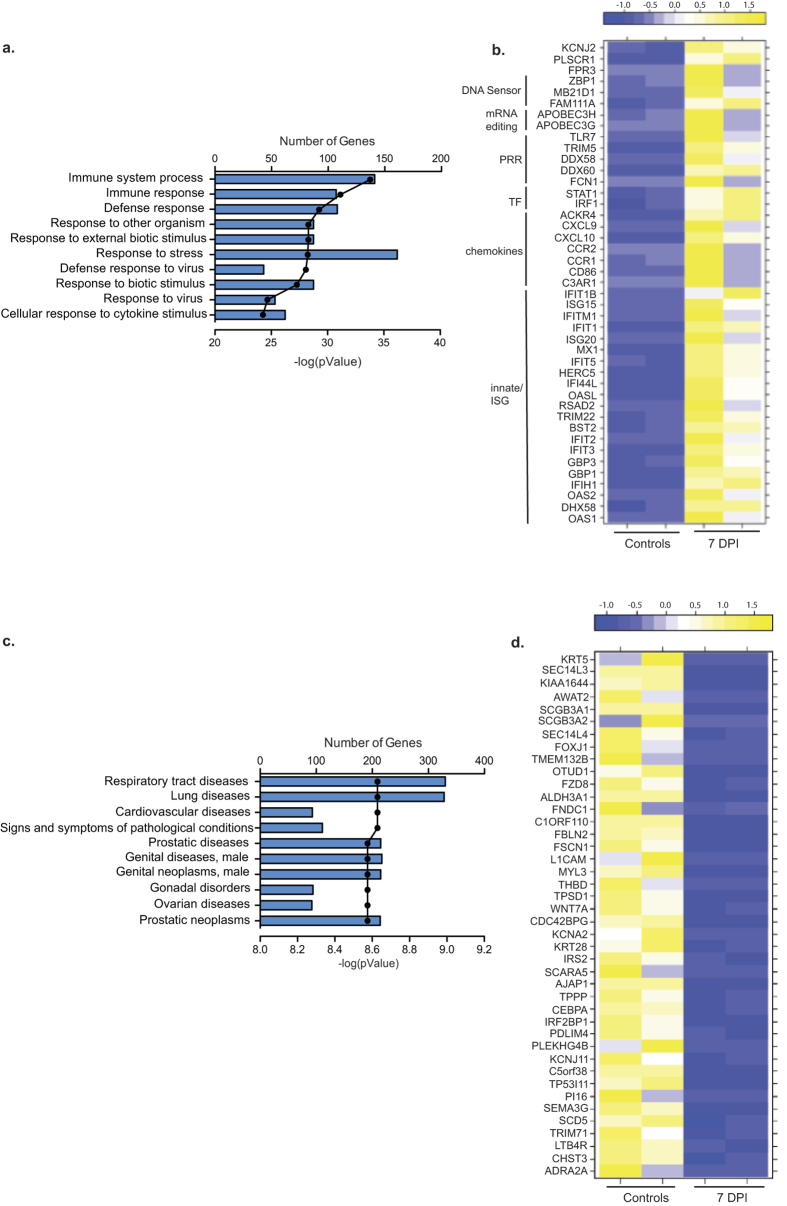
Figure 7. DEGs detected 7 DPI are involved in host defense.
(a) Bar graph shows the number of genes mapping to each of the 10 most statistically significant GO terms to which the 380 up-regulated genes enriched. Line represents the −log(p-value) associated with each GO term (b) Heat map of the genes that mapped to the GO process “response to virus” grouped by function (PRR = pathogen recognition receptor; TF = transcription factor; ISG = immune stimulated gene). (c) Bar graph shows the number of genes mapping to each of the 10 most statistically significant disease pathways to which 400 down-regulated genes enriched. Line represents the −log(p-value) associated with each GO term. (d) Heat map of the DEGs with a FC >8 that enriched to “respiratory tract diseases” and “lung diseases”.

