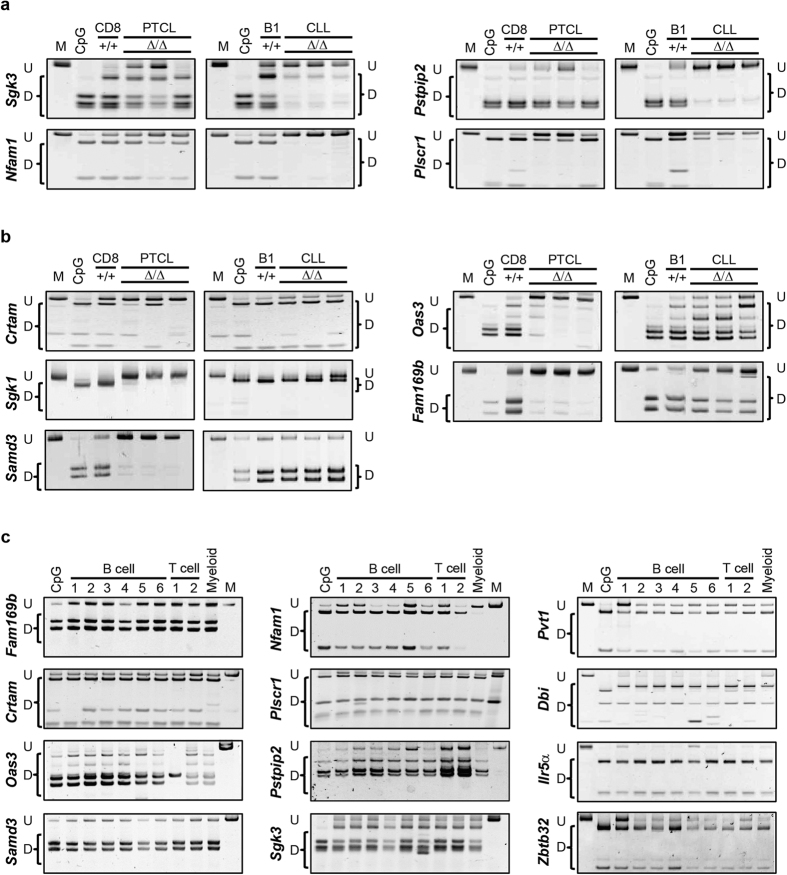
Figure 5. Promoter hypomethylation in Dnmt3aΔ/Δ CLL and PTCL is common in additional tumors.
COBRA analysis of promoter methylation for (a) Sgk3, Nfam1, Pstpip2, Plscr1 and (b) Crtam, Sgk1, Samd3, Oas3 and Fam169b in wild-type CD8+ T cells, wild-type B-1a cells, Dnmt3aΔ/Δ PTCL and Dnmt3aΔ/Δ CLL samples. PCR fragments amplified from bisulfite-treated genomic DNA were digested with the restriction enzymes BstUI, Taq1 or TaiI. Undigested (U) and digested (D) fragments correspond to unmethylated and methylated DNA, respectively. Control PCR fragments generated from fully methylated mouse genomic DNA that is undigested (M) or digested (CpG) are shown. (c) COBRA analysis of promoter methylation for Fam169b, Crtam, Oas3, Samd3, Nfam1, Plscr1, Pstpip2, Shk3, Pvt1, Dbi, Il5ra, and Zbtb32. The following samples were isolated from wild-type mice, B cell subsets: (1) splenic B-1a, (2) bone marrow immature B cells, (3) bone marrow mature B cells, (4) splenic CD19+ B cells, (5) splenic marginal zone B cells, (6) splenic follicular B cells, T cell subsets: (1) splenic CD4+ T cells, (2) splenic CD8 T cells and lastly CD11b+ (Myeloid) splenic cells.

