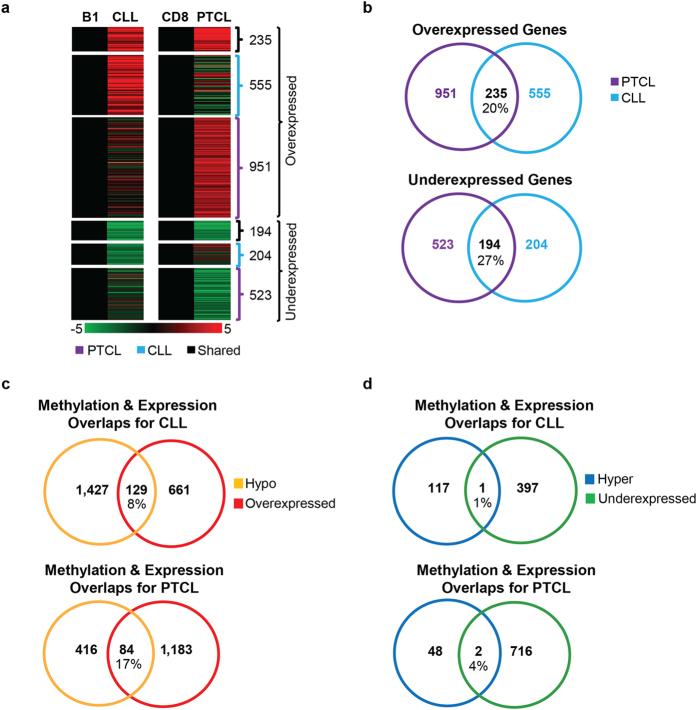
Figure 6. Gene expression is deregulated in a cell-specific manner in Dnmt3aΔ/Δ CLL and PTCL.
(a) Heat maps derived from global expression profiling by RNA-seq. 555 Genes were overexpressed exclusively in Dnmt3aΔ/Δ CLL (N = 8) relative to B-1a (B1) controls (N = 2), 951 genes were overexpressed exclusively in Dnmt3aΔ/Δ PTCL (N = 3) relative to CD8 controls (N = 2), and 235 genes were overexpressed in both tumor types. 204 Genes were underexpressed exclusively in Dnmt3aΔ/Δ CLL relative to B1 controls, 523 genes were underexpressed exclusively in Dnmt3aΔ/Δ PTCL relative to CD8 controls, and 194 genes were underexpressed in both tumor types. A color bar is shown to reference fold change with upregulation in red and downregulation in green. Only genes with a fold change ≥2 and a q-value <0.05 are shown. (b) Venn diagram showing the number of unique and overlapping differentially expressed genes in CLL (blue) and PTCL (purple). (c,d) A graphical presentation of the number of genes differentially expressed (red; overexpression, green; underexpression) and the number of genes differentially methylated at the promoter region (yellow; hypomethylation, blue; hypermethylation) in Dnmt3aΔ/Δ CLL relative to B1 controls and in Dnmt3aΔ/Δ PTCL relative to CD8 controls. The number of genes with corresponding methylation and expression changes (Hypomethylated and overexpressed; top and hypermethylated and underexpressed; bottom) are shown in the overlapping portion of the circles.

