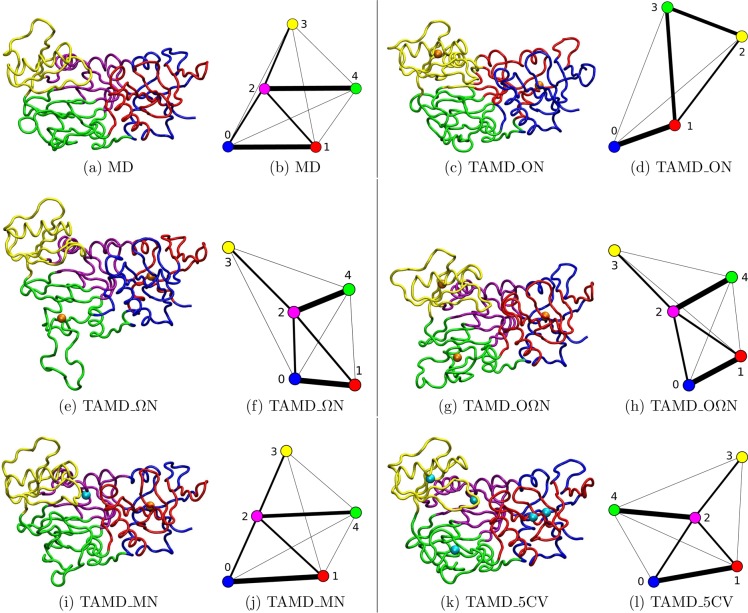
Figure 2.
Communities determined by the Girvan–Newman algorithm59 along the MD and TAMD trajectories recorded on VanA. The same color code was kept for the communities both on the 3D structures and on the graphs: the communities mainly located in the N-terminal region (numbers 0 and 1) are shown in blue and red; the Middle (number 2) community is shown in magenta, if it exists; the Opposite region is shown in yellow (number 3); the ω-loop and the main part of the C-terminal are shown in green (number 4). Projection of the communities calculated on a 30-ns trajectory of VanA for (a) MD, (c) TAMD_ON, (e) TAMD_ωN, (g) TAMD_OωN, (i) TAMD_MD, and (k) TAMD_5CV. Also shown is a graph of the interconnectivity calculated between the different communities for (b) MD, (d) TAMD_ON, (f) TAMD_ωN, (h) TAMD_OωN, (j) TAMD_MD, and (l) TAMD_5CV. The collective variables (CV) used for TAMD trajectories are represented by orange balls when they were derived from structural calculations and cyan balls if they were obtained from the communities calculations.

